
AUD/USD Breaks Support as Fed and RBA Divergence Widens
Bearish momentum was unleashed for the Aussie dollar on Friday when another strong Nonfarm Payrolls report boosted the odds of another Fed rate hike. A total of 172k jobs were added in May, taking the three-month gain to more than half a million. Unemployment remained low and unchanged at 4.3%.
We had already seen ISM reports point to resilient growth and elevated inflationary pressures, with the NFP figures serving as the icing on a hawkish US dollar cake. Fed funds futures are now implying a 46.6% probability of a 25bp hike in September.
This saw AUD/USD break decisively below 71c, bringing my 70c target within reach. But with the RBA likely having reached the peak of its tightening cycle and expectations for further Fed hikes resurfacing, AUD/USD could now be on course to revisit the 60s.
View related analysis:
- Australian Dollar Outlook: AUD/USD Extends Gains, But Pullback Risks Remain
- Japanese Yen Outlook: Volatility Perks Up Ahead of NFP for USD/JPY and AUD/JPY
- US Dollar Outlook: USD Bulls Flex into NFP, AUD and NZD Slide
- Nasdaq 100 Futures Slip as KOSPI Leads Tech Selloff Across Asia
- FX Futures Positioning: US Dollar Bulls Return, Yen Bears Tease MOF
Australian Dollar Performance
As is usually the case, the reversal in the Aussie dollar has taken time to play out. But with multiple clues emerging across the major FX pairs and momentum turning against the bulls, the pullback in AUD crosses is now in full swing – apart from AUD/NZD, where NZD weakness has provided support.
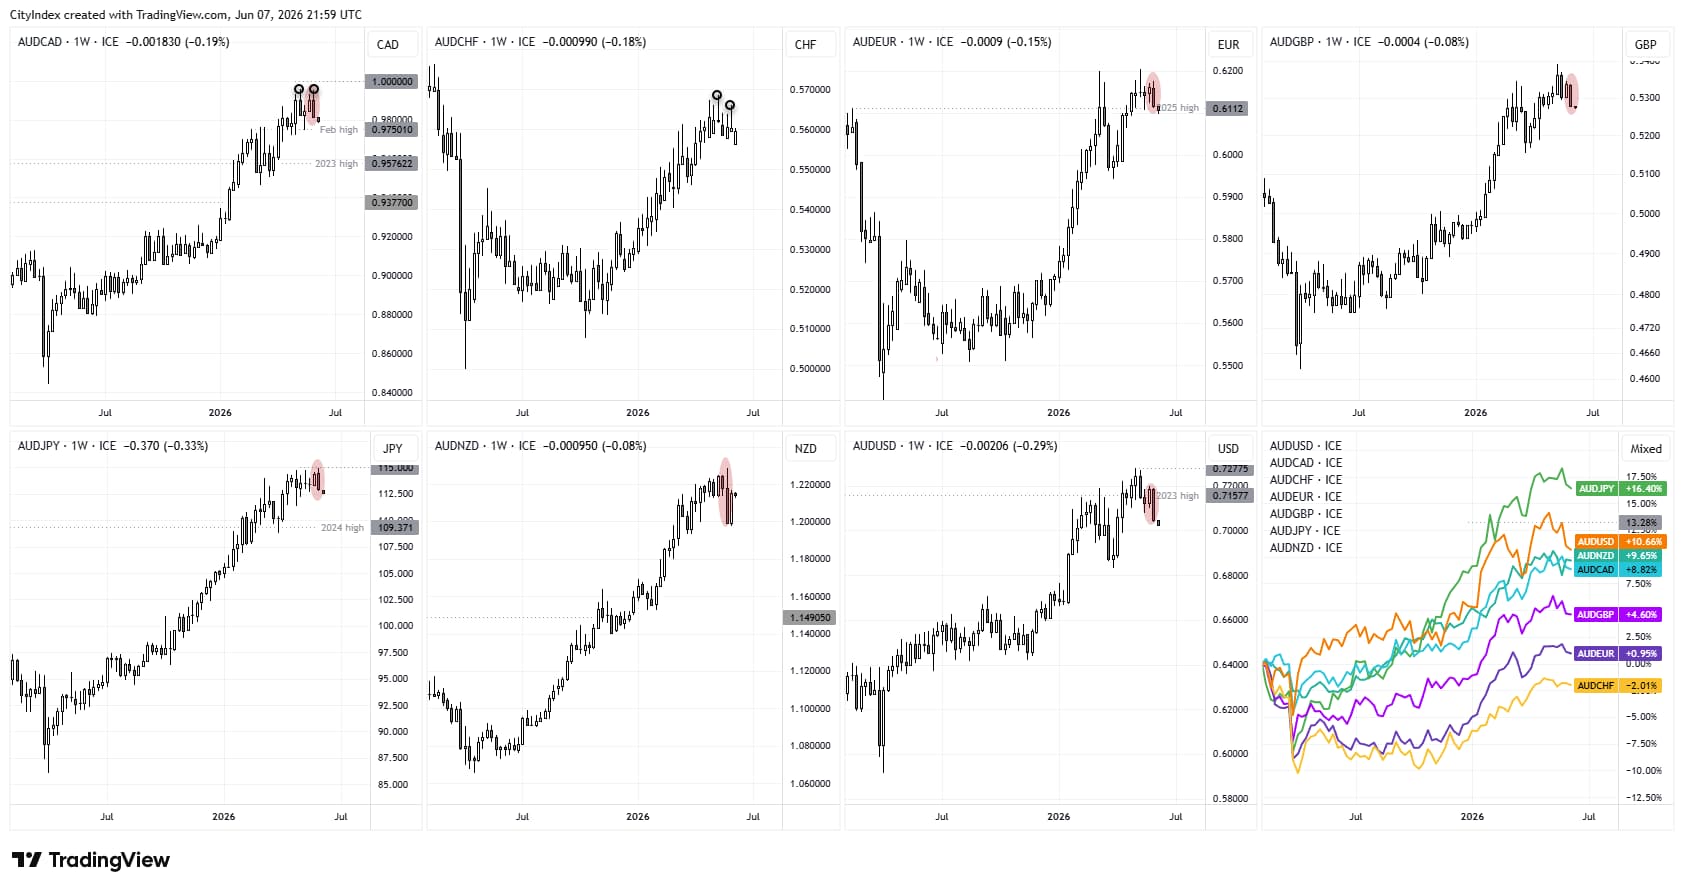
Chart prepared by Matt Simpson - Source: LSEG
- AUD/USD: Bearish engulfing week, its most bearish week in 10
- AUD/CAD: Bearish engulfing week, double top just below parity
- AUD/CHF: Last week's bearish pin bar formed a lower high
- AUD/EUR: Bearish outside week, lower high, and now considering a break below the 2025 high
- AUD/GBP: Closed at an eight-week low and fell for a second week in three after its bearish engulfing week at a three-year high
- AUD/JPY: Bearish engulfing week at a 36-year high after bulls once again failed to probe above 115
- AUD/NZD: Bullish inside week, largely because the New Zealand dollar underperformed relative to the Australian dollar

RBA Signals Rates on Hold After Signs of Slowing Growth
RBA Governor Lower effectively confirmed that the RBA will hold rates steady on June 16, noting there are "signs that this tightening is starting to work" and that the RBA is well positioned to respond to developments, having raised the cash rate three times.
Economic growth slowed in Q1, with GDP rising just 0.3% q/q, its weakest pace since Q2 2024. And this was despite a surge in data centre investment. Strip that away and the picture looks far less encouraging. With employment softening and CPI not running excessively hot, the RBA is unlikely to be in a rush to deliver another 25bp hike. That leaves open the possibility that we have already seen the final hike of this cycle.
The OIS curve continues to flatten, signalling lower odds of higher rates one year out. Markets are pricing a hold in June and just a 24% probability of a rate hike within the next three months.
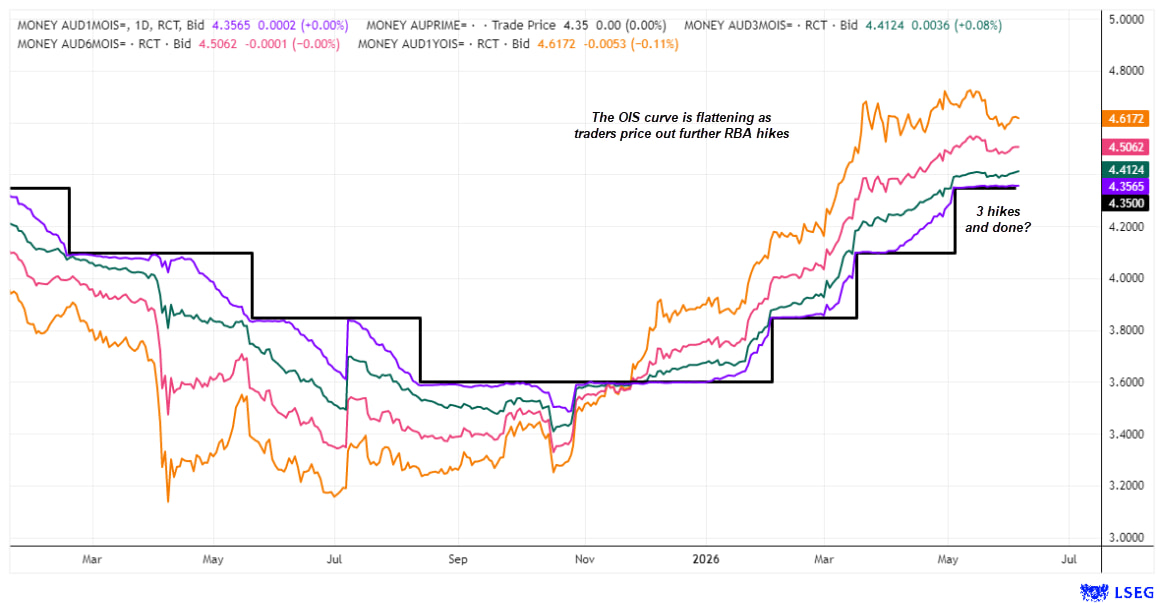
Source: LSEG
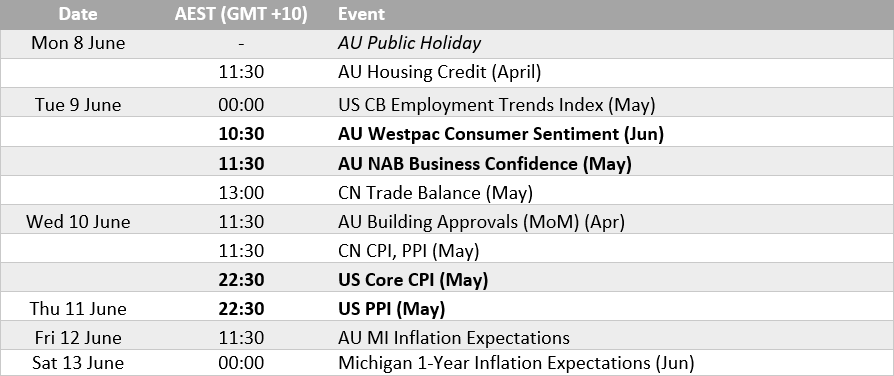
Australia This Week: Economic Data and Events for AUD/USD Traders
US Inflation in Focus as Markets Reprice Fed Expectations
US inflation data is the main event, though I won't be expecting any dovish miracles given the elevated inflationary pressures. The ISM Services Prices Paid Index remains near a four-year high, even if its surge has slowed. Peace in the Middle East remains uncertain, helping to keep crude oil prices supported. Core PCE also continues to trend higher. It is therefore a case of whether CPI slows, and if so, by how much.
Money markets are now pricing in a single 25bp hike later this year, while some Fed members are already making hawkish noises. They tend to converge towards the same script over time, and the early birds have already made their preferences known.
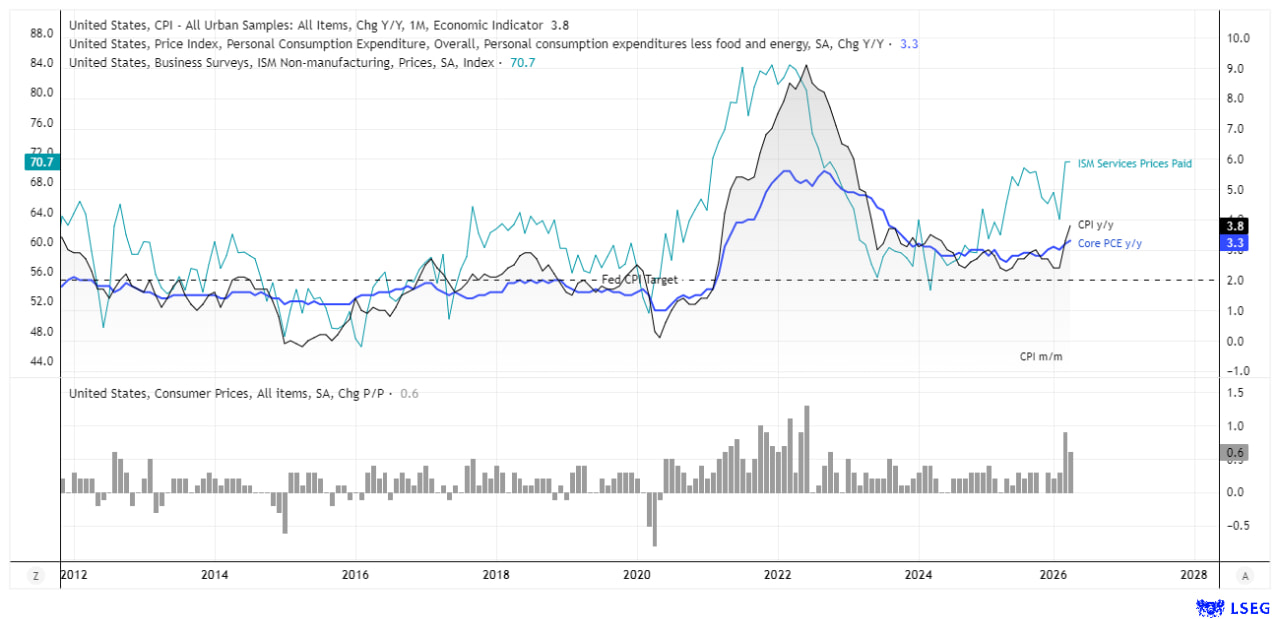
Source: BLS, ISM, LSEG

AUD/USD Technical Analysis: Australian Dollar vs US Dollar
AUD Correlations
When correlations approach perfection (near 1 or -1) across multiple markets, it is often a sign that macro drivers are back in control. That is exactly what we have seen with AUD/USD, with the US dollar firmly in the driver's seat. The inverse correlation between the Australian dollar and US dollar sits near -1 across the 3, 10 and 20-day timeframes, while strong relationships are also evident with risk sentiment via the S&P 500, China via the yuan and copper, and, of course, the New Zealand dollar.
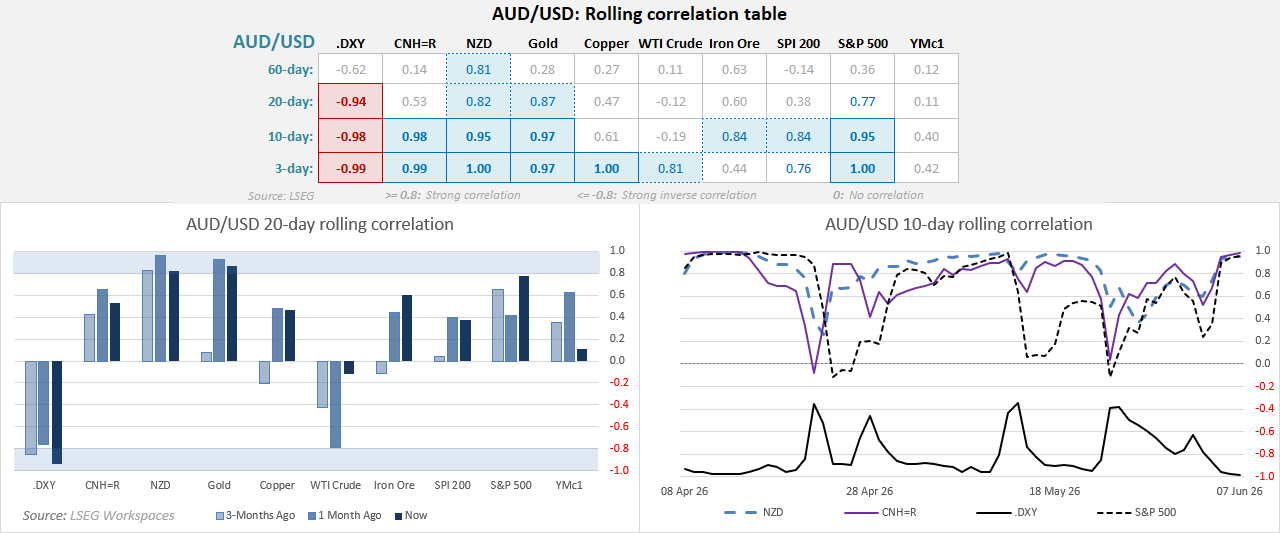
Source: LSEG
AUD/USD Futures Positioning | COT Report
Traders continued to unwind their long Aussie dollar bets last week, even before bearish momentum took hold towards the end of the week. Interestingly, shorts also declined slightly as bears opted to de-risk rather than add fresh downside exposure.
Combined, large speculators and asset managers reduced their gross-long exposure by 43.7k contracts, bringing the total reduction over the past two weeks to 131.5k contracts. Asset managers were on the cusp of flipping to net-short exposure, with net-long positioning standing at a mere 856 contracts. Given Friday's bearish volatility, they have likely already moved into net-short territory.
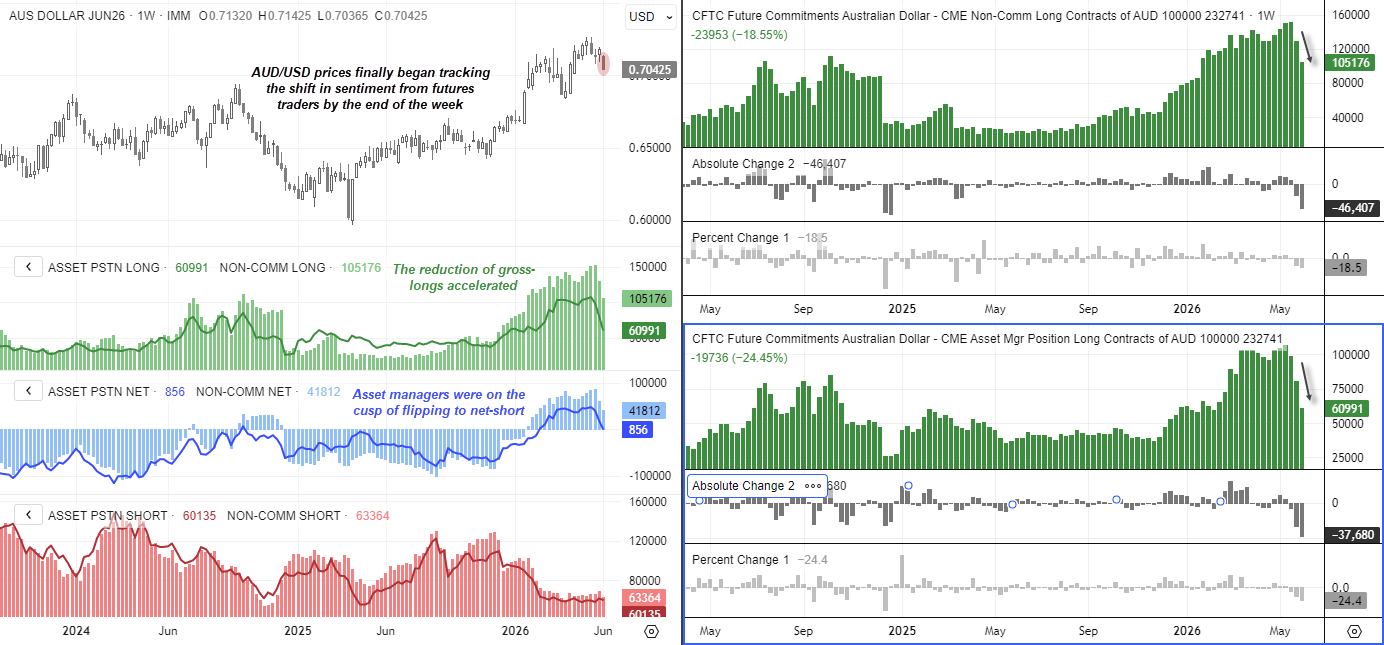
Source: CFTC (COT) CME, LSEG
For traders wanting a deeper understanding of futures positioning, I’ve also published a guide on how to read and interpret weekly COT data in forex markets.
AUD/USD Bears Tighten Grip as 70c Target Comes Into View
There is little change to last week's analysis. The 70c level remains the next downside target, and I suspect bears will continue to fade rallies. However, any rebounds may prove shallower than they were a week ago following the strong bearish breakout from AUD/USD's multi-week consolidation.
The 100-day EMA is providing support for now, but the AU-US 2-year yield spread continues to point lower and is on the cusp of breaking to fresh lows. At the same time, risk reversals are curling lower, signalling rising demand for puts relative to calls. Taken together, the evidence suggests bears remain firmly in control.
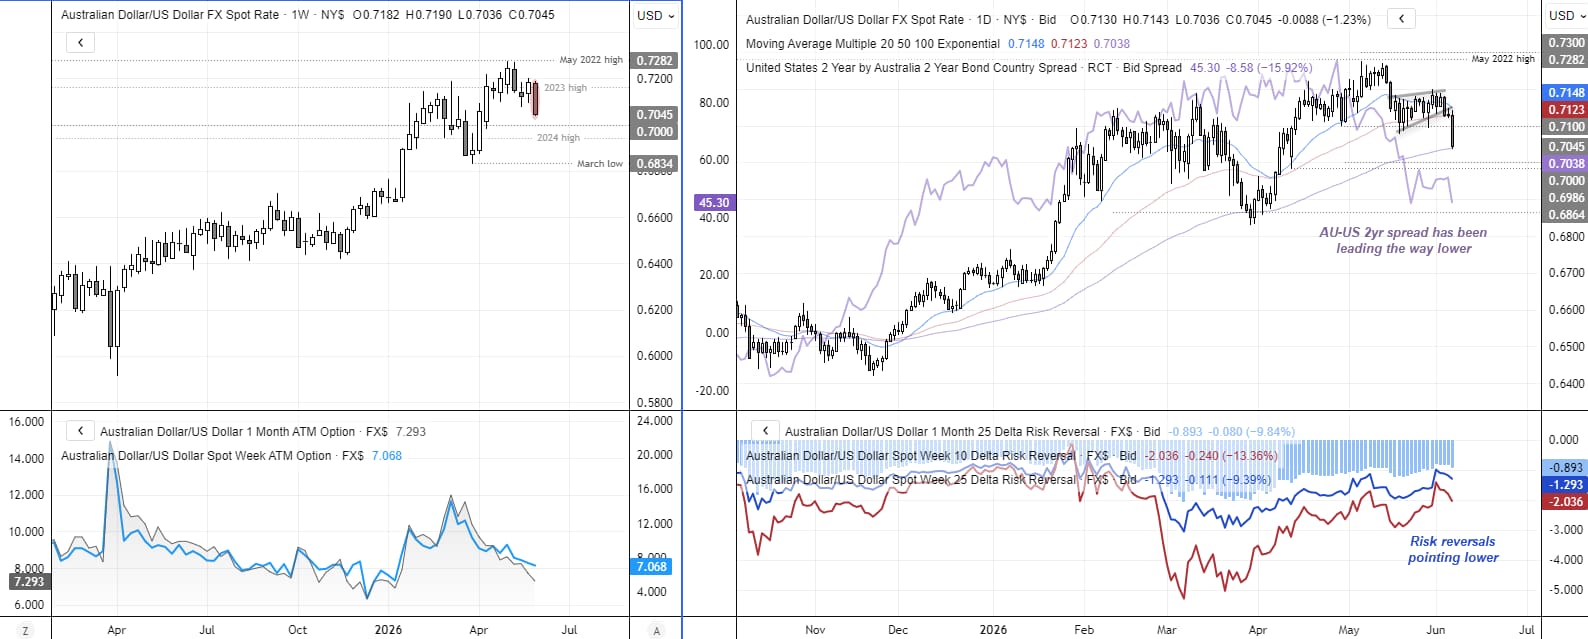
Source: ICE, TradingView
View the full economic calendar
-- Written by Matt Simpson
Follow Matt on Twitter @cLeverEdge
How to trade with City Index
You can trade with City Index by following these four easy steps:
- Open an account, or log in if you’re already a customer
• Open an account in the UK
• Open an account in Australia
• Open an account in Singapore
- Search for the market you want to trade in our award-winning platform
- Choose your position and size, and your stop and limit levels
- Place the trade