
The usually quiet Asian session ahead of Nonfarm Payrolls was anything but subdued on Friday, as a sudden selloff in South Korea's KOSPI index sent shockwaves through regional markets. The move quickly spilled into technology stocks, dragging Nikkei futures and Nasdaq 100 futures lower despite the absence of an obvious catalyst. While the KOSPI later staged an impressive rebound, the episode highlighted how sensitive sentiment has become after months of relentless gains in global equity markets.
View related analysis:
- Gold Outlook: Bulls Eye Rebound, Though Futures Exposure Remains Weak
- Japanese Yen Outlook: Volatility Perks Up Ahead of NFP for USD/JPY and AUD/JPY
- AUD/USD Bear Case Builds as AUD/NZD Signals Top, GBP/AUD Eyes Rebound
- How to Read the COT Report to Track Forex Market Sentiment
KOSPI Selloff Sends Shockwaves Through Asian Tech Stocks
KOSPI Slumps as Tech Stocks Trigger Risk-Off Move Ahead of NFP
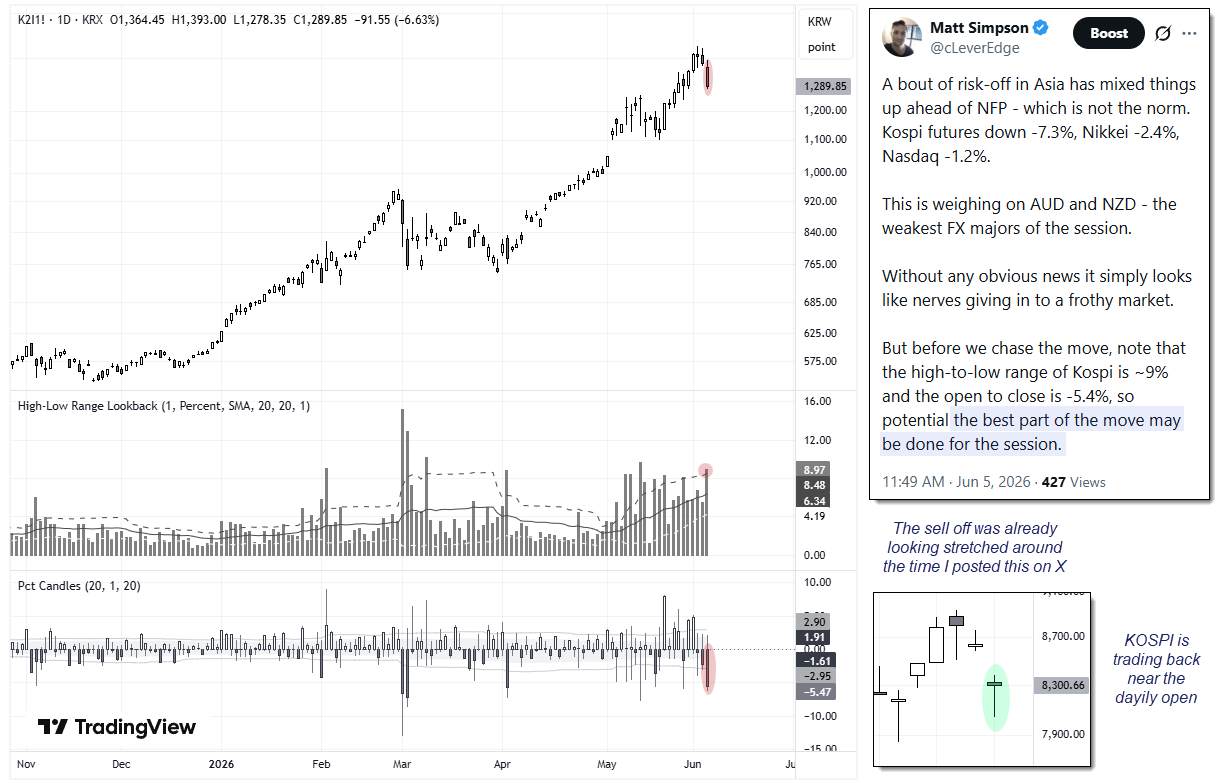
The Asian session leading into the Nonfarm Payrolls report is usually quiet, often bordering on unresponsive. So it came as quite a surprise to see a Reuters newsflash appear on my screen stating that the KOSPI index had fallen 6.4%. A quick scan of the usual news and social media channels revealed no obvious trigger, but I could see that Nikkei futures were down more than 2% and Nasdaq futures had slipped 1.2%. There is clearly a tech theme at play, although the reason remains unclear. However, given how frothy markets have become, it seems plausible that profit-taking ahead of the NFP report could help explain the sudden moves.
Source: CME, TradingView, X.com
KOSPI Rebounds After Panic Selloff
Given the KOSPI appeared to be driving the move, it seemed a good place to start when assessing its severity. Around the time I posted the chart below on X, I noted that the selloff was already approaching extreme levels. The intraday high-to-low range had reached around 9%, placing it close to recent extremes, while the open-to-close decline of around 5.5% exceeded every bearish daily close since early March.
It was therefore encouraging to see prices reverse not long after that post. The KOSPI has since retraced losses back towards its opening price, effectively erasing the intraday selloff aside from the gap lower. And if the KOSPI has indeed found stability, then perhaps the Nasdaq has too.
Nasdaq 100 Technical Analysis
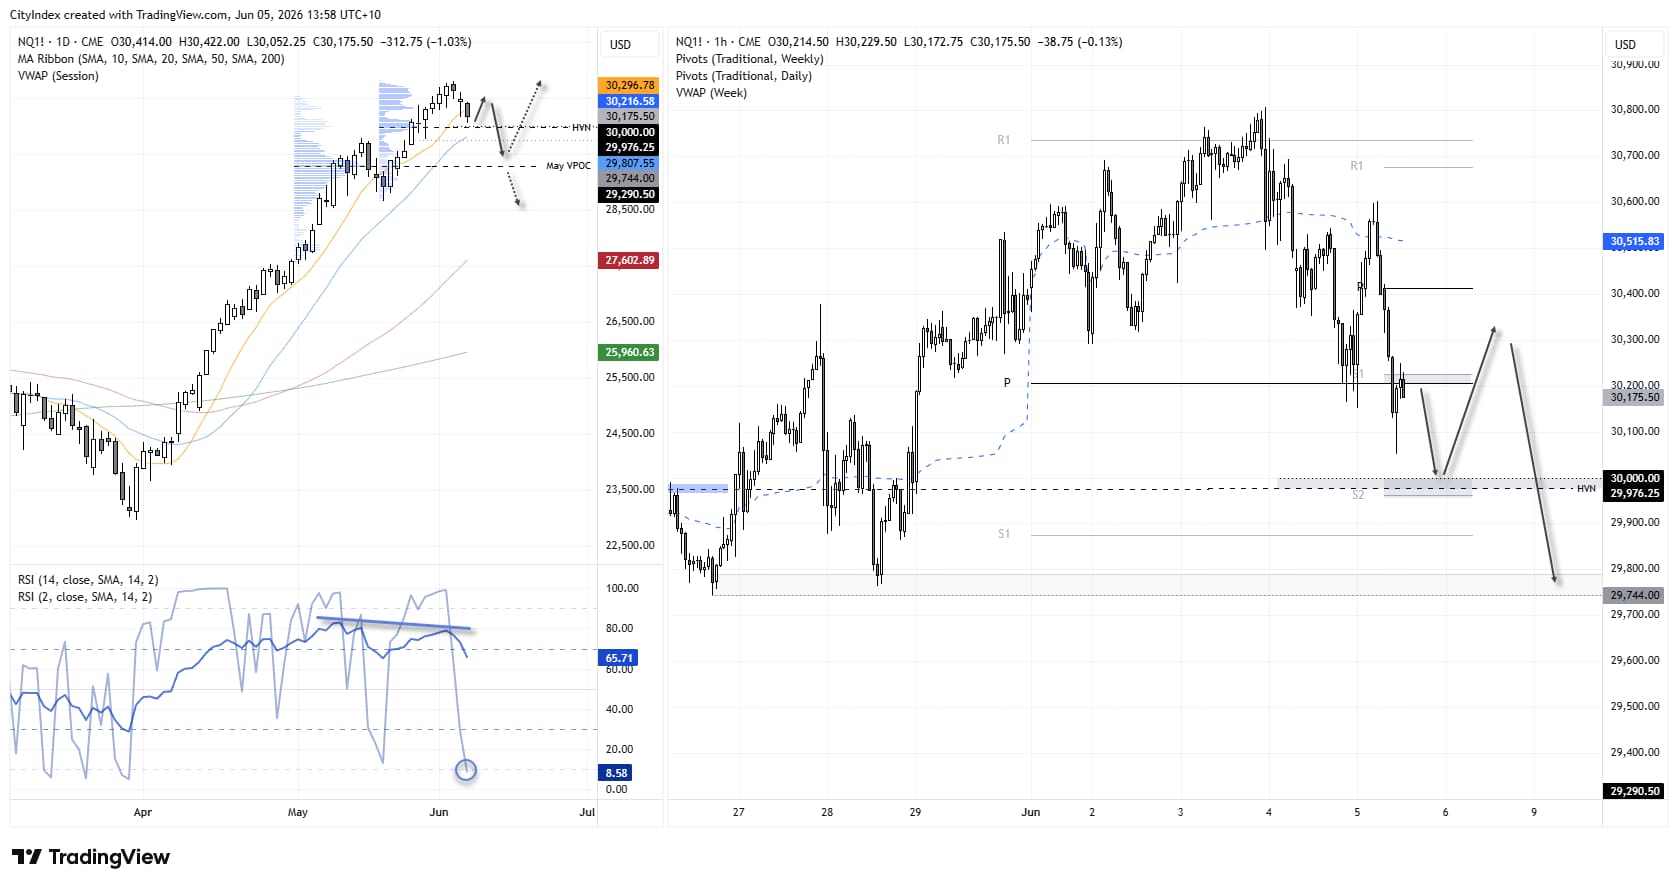
We’ve seen a near-35% rally in Nasdaq 100 futures from the March low to the June high. While a correction could be due, there has really only been one meaningful pullback throughout this rally—and that lasted just three days. It is therefore worth noting that we are already on day three of a potential pullback, and with support nearby there is every chance that a swing low has already formed.
That said, with NFP on the horizon, traders should still factor in the potential for two-way volatility or a deeper pullback.
- Note the high-volume node (HVN) near the 30,000 handle, which presents an obvious nearby target for bears and a potential support zone for bulls.
- But while prices hold above the 29,744 low, the temptation for bulls to return—even if just for a cheeky bounce—remains in place.
- A break beneath 29,744 opens the door for a move towards the May VPOC at 29,290.
Source: CME, TradingView
For traders wanting a deeper understanding of futures positioning, I’ve also published a guide on how to read and interpret weekly COT data in forex markets.
Nasdaq 100 Futures (NQ) Market Positioning | COT Report
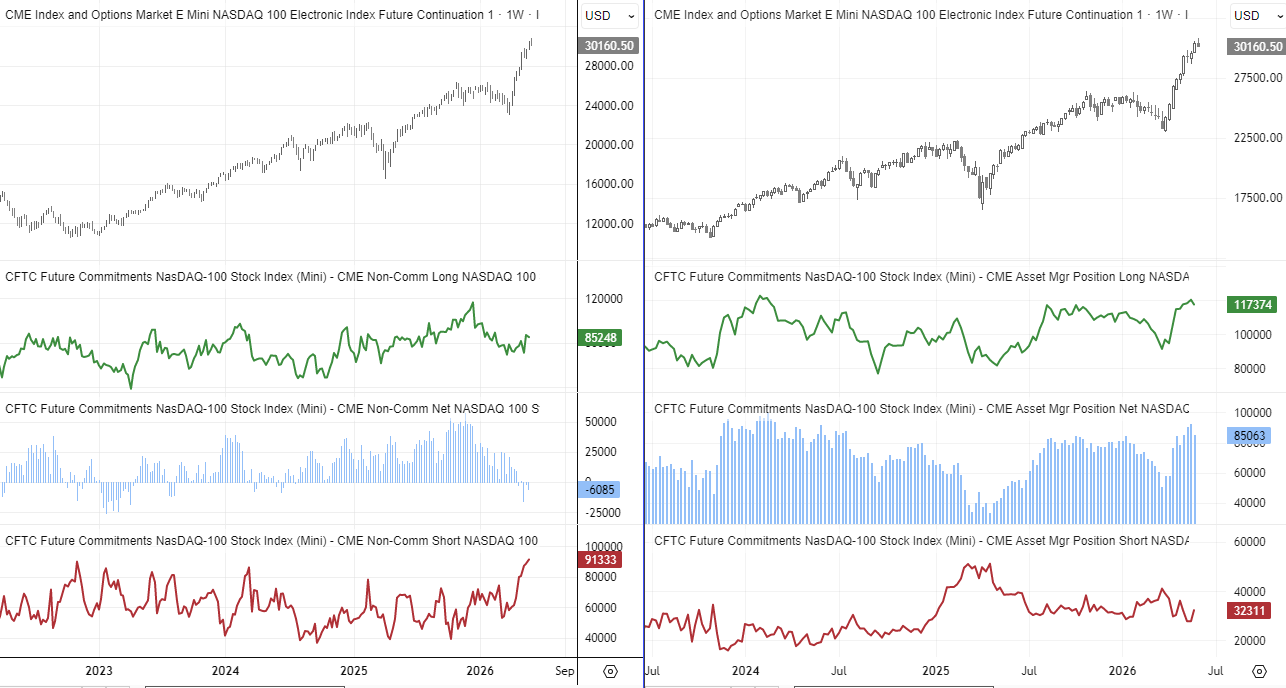
Looking a bit further out, perhaps the mighty Nasdaq is approaching a sentiment extreme. Gross-long exposure among asset managers reached its highest level since February 2024, while a modest rise in short exposure has trimmed their net-long position. At the same time, a surge in gross-short exposure among large speculators saw them flip to a net-short position four weeks ago. Given the strength of the rally already seen, perhaps at least a pause in the trend is due—if not a pullback.
What could prove decisive in the coming weeks is whether asset managers begin to meaningfully increase their short exposure.
Source: CME, CFTC (COT), LSEG
View the full economic calendar
-- Written by Matt Simpson
Follow Matt on Twitter @cLeverEdge
How to trade with City Index
You can trade with City Index by following these four easy steps:
- Open an account, or log in if you’re already a customer
• Open an account in the UK
• Open an account in Australia
• Open an account in Singapore
- Search for the market you want to trade in our award-winning platform
- Choose your position and size, and your stop and limit levels
- Place the trade