
Bitcoin has capitalised on the past month’s risk-on rally, with BTC/USD pushing towards the key 80k level. Yet while bulls remain in control on the surface, the broader crypto market is telling a more cautious story.
Altcoins have failed to confirm the move, and futures positioning points to stretched bullish sentiment—raising the risk that this rally is more corrective than impulsive.
With Bitcoin now approaching a major psychological and technical level, traders should brace for volatility and the possibility that this move is nearing exhaustion.
View related analysis:
- Gold Loses Safe-Haven Appeal as Iran Skips Talks, Ceasefire Extended
- US Dollar Outlook: Peak War Uncertainty Weighs on USD, USD/CHF Eyes Breakdown
- FX Futures Positioning: USD, EUR, GBP, CAD | COT Report
Bitcoin Nears 80k as Diverging Crypto Momentum Raises Reversal Risk
Bitcoin Leads While Altcoins Lag
Bitcoin has made the most of the past four weeks’ risk-on rally, with BTC/USD spot prices nearing 80k for the first time since early February. Ethereum is keeping pace to a degree, although its rally has been far messier.
And that’s where the party ends.
Looking across XRP, SOL, LTC, ADA and DOGE, price action shows a lacklustre attempt to break out of sideways ranges. Dow Theory followers will note that a true bullish move should be confirmed across major markets, yet what we’re seeing is large-cap crypto leaving alt coins behind.
Even then, the rallies in BTC/USD and ETH/USD look tame compared to the ‘good old days’—and to my eye, appear corrective. With Bitcoin now approaching resistance, there’s a strong case that the best of this move may already be behind us.

Source: Binance, Forex.com, TradingView
Bitcoin Futures (BTC) Positioning – COT report:
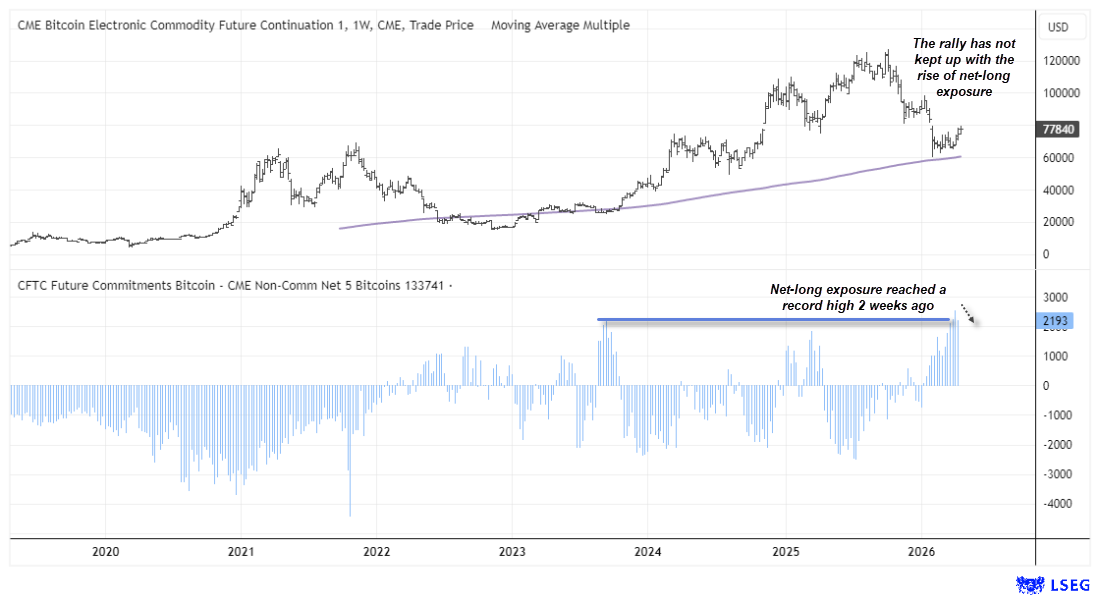
The weekly charts shows bitcoin futures remains in a clear downtrend, though momentum has turned higher since the February low. It is possible BTC is in the wave ‘C’ of a classic ABC correction. Also note that resistance looms around 80k and the November low.

Record BTC Positioning Signals Potential Sentiment Peak
More importantly, we may have seen a sentiment extreme two weeks ago, as large speculators pushed net-long exposure in BTC/USD futures to a record high. Notably, positioning dipped slightly last week from that peak, suggesting bullish exposure may have risen faster than underlying futures prices.
With sentiment stretched, prices hovering near resistance, and altcoins still stuck around their cycle lows, there is a growing risk that this move is nearing exhaustion. If so, it raises the possibility that wave C is close to completion.
Source: CME, TradingView
Bitcoin (BTC/USD) Technical Analysis
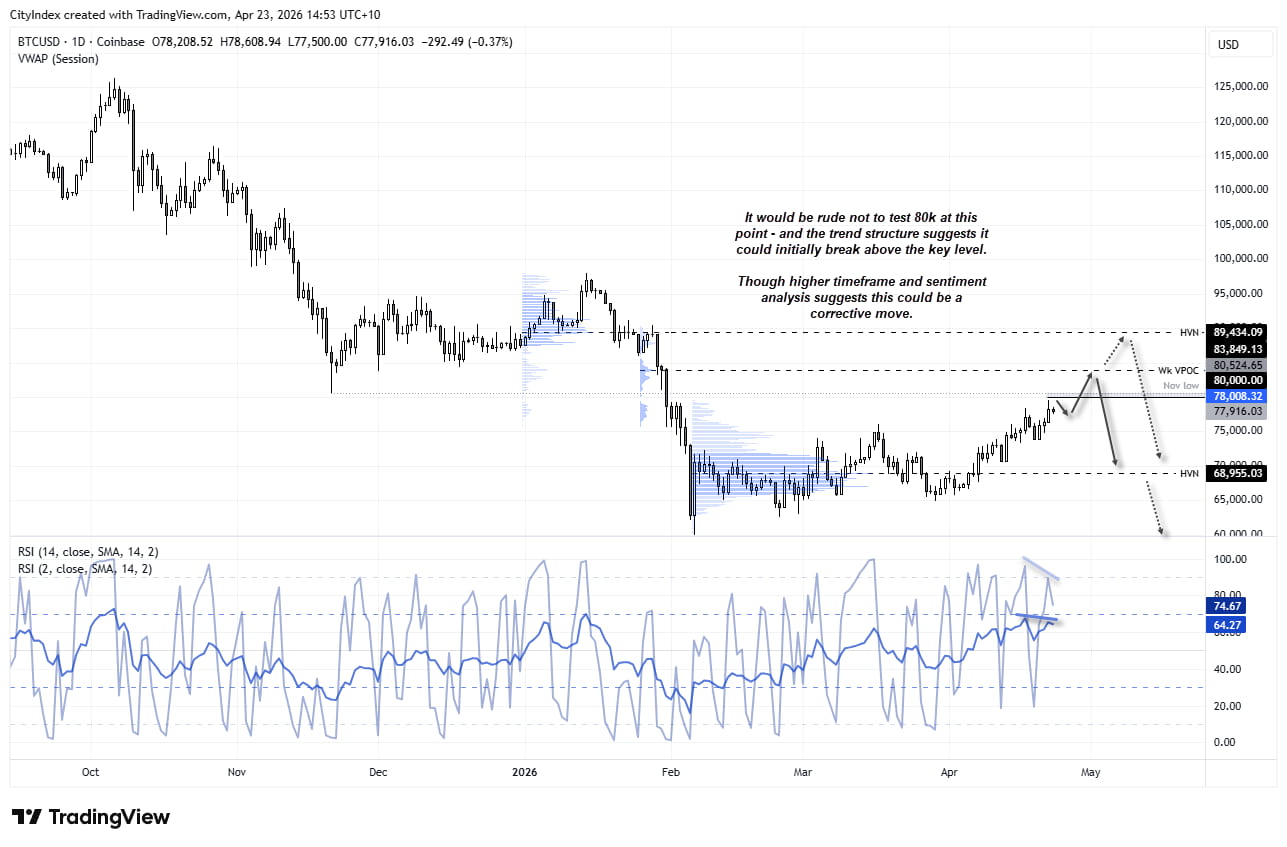
Putting the prospects of a sentiment extreme and lagging altcoins to one side, the daily chart still shows an uptrend for Bitcoin. With 80k now within reach, it would be surprising not to see price at least test that level, with the potential for choppy, two-way volatility around it.
A small bearish divergence has formed on RSI (2) and RSI (14), although the latter has yet to reach overbought territory. That leaves the door open for a push above 80k before any meaningful pullback takes hold.
Unless we see clear signs of a swing high around 80k, bulls could target the weekly VPOC at 83,850 or the monthly VPOC at 89,434.
However, if this rally is indeed a false flag and marks the latter stages of a corrective wave C, the more compelling move may ultimately be to the downside.
Source: Coinbase, TradingView
View the full economic calendar
-- Written by Matt Simpson
Follow Matt on Twitter @cLeverEdge
How to trade with City Index
You can trade with City Index by following these four easy steps:
- Open an account, or log in if you’re already a customer
• Open an account in the UK
• Open an account in Australia
• Open an account in Singapore
- Search for the market you want to trade in our award-winning platform
- Choose your position and size, and your stop and limit levels
- Place the trade