



Gold prices fell sharply after the latest ceasefire extension reduced demand for safe-haven assets, despite Iran failing to attend peace talks. While initial risk-off flows lifted oil and the US dollar, the muted follow-through suggests markets are increasingly confident that geopolitical risks have peaked, keeping risk appetite broadly supported.
View related analysis:
- Gold Outlook: Rally Slows Near $5000 as Bearish Signals Build
- US Dollar Outlook: Peak War Uncertainty Weighs on USD, USD/CHF Eyes Breakdown
- US Dollar Index Outlook: Bullish Bounce Overshadowed by Major Top Risk
- FX Futures Positioning: USD, EUR, GBP, CAD | COT Report
Gold Weakens as Ceasefire Extension Dampens Safe-Haven Demand
A mild bout of risk-off was triggered on Tuesday following reports that Vice President Vance’s trip to Pakistan for US-Iran peace talks had been postponed. Pakistan was left hanging, awaiting formal confirmation from Iran of their attendance—confirmation that never arrived. Iran eventually stated that talks could resume once the US lifted its military blockade on Iranian exports.
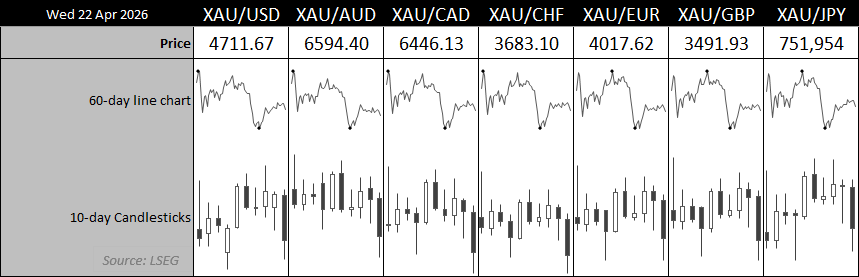
The usual market reactions followed. Brent crude oil rose above $100 a barrel, with the US dollar strengthening in tandem. Wall Street indices pulled back from what could be described as complacent record highs. Gold is turning lower after a failed bid to break above $5000.
Yet the moves were limited, as President Trump was quick to announce that the ceasefire had been extended anyway. The fact that Iran did not attend the talks yet still received an extension helps explain why markets are betting that peak war uncertainty is now firmly in the rear-view mirror. From that perspective, risk appetite is likely to remain supported, with traders continuing to buy dips on Wall Street and fade rallies in the US dollar.
Source: LSEG

Markets Mixed: USD Leads, Metals Slide, Oil Surges as Gains Fade Late
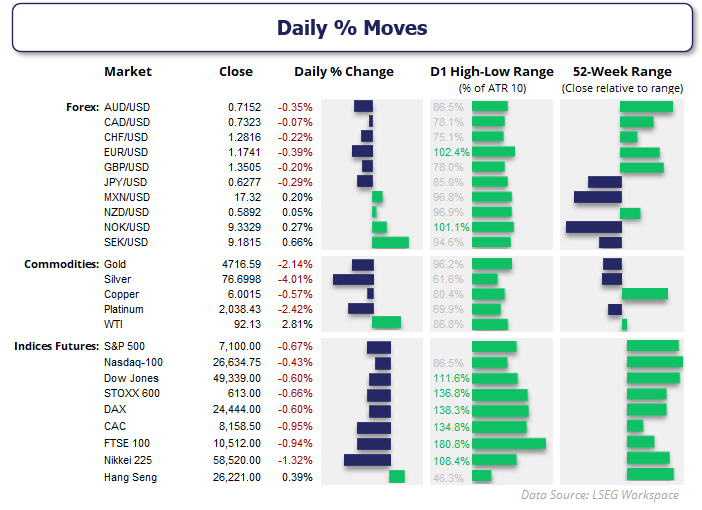
Markets were mixed, with the US dollar broadly firmer across FX while metals sold off sharply—led by a more than 2% drop in gold. In contrast, WTI crude oil surged nearly 3%, while global equity indices traded softer.
- The US dollar was the strongest FX major, though the ceasefire extension saw USD strength soften towards the end of the US session
- EUR/USD formed a bearish outside day
- AUD/USD posted a small bearish session near its cycle highs, reinforcing the case for ‘chop at the top’ after its extended run towards 0.72 last week
- NZD/USD handed back most of the day’s gains after firmer New Zealand inflation data on Tuesday
- USD/CAD snapped a six-day losing streak, though the narrow-range candle poses little threat to its broader bearish trend structure
- USD/JPY closed at a six-day high, though it remains within a multi-week range on the daily chart
- Metals were broadly lower, with silver leading gold to the downside
- WTI crude oil rose 2.8%, erasing losses from the prior two sessions
- Global index futures were broadly lower, with the S&P 500, Nasdaq and DAX down around -0.6%, the FTSE 100 off -1%, and Nikkei futures down -1.3%
Source: LSEG
Gold Futures (GC) Technical Analysis
Gold Falls as Ceasefire Extension Erodes Safe-Haven Demand
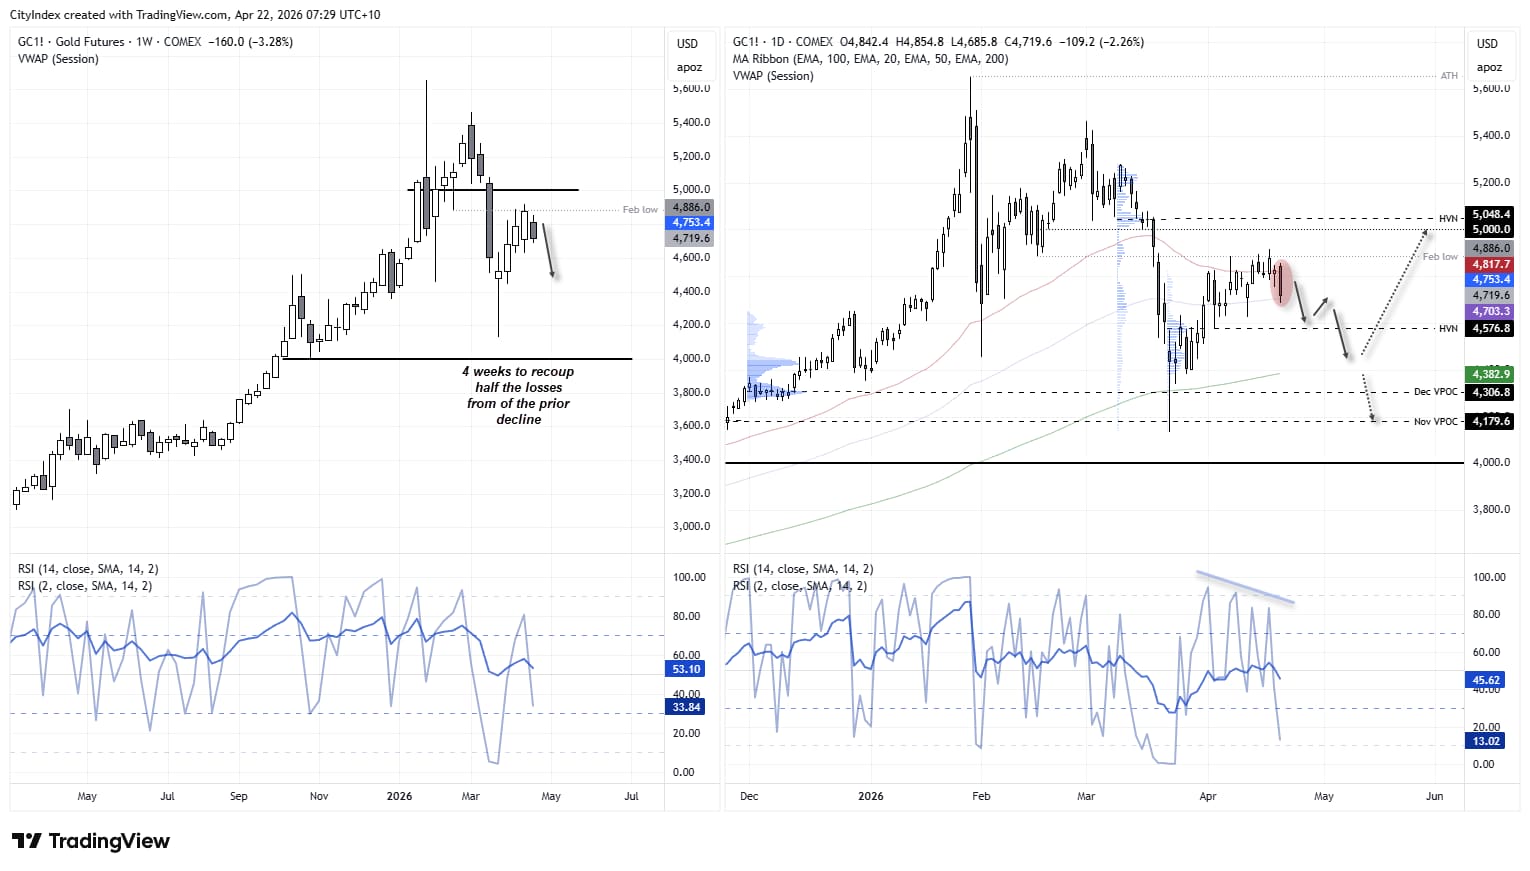
President Trump’s latest ceasefire extension has reduced gold’s appeal as a safe haven, and prices sold off accordingly on Tuesday. Gold futures are back below 4800 after their worst session in 12 days, reinforcing my view that a potential top is forming beneath a key resistance cluster.
In recent analysis, I noted that gold had already risen for four consecutive weeks, yet had only recovered around half of the losses sustained during a similar decline. When a market takes longer to rise than it did to fall, it suggests bulls remain cautious about the recovery.

Gold Technical Analysis: Bearish Engulfing Signals Lower High Risk
The daily chart shows that price action became increasingly choppy during gold’s advance, particularly over the past couple of weeks. The loss of bullish momentum led to more overlap between candles, allowing a bearish divergence to form on RSI (2), while RSI (14) has begun to curl lower. Also note how gold failed to break and hold above the February low.
Tuesday’s bearish engulfing candle suggests momentum has turned lower after bulls were rejected at the February low, and it may mark a lower high on the daily chart. While the 100-day EMA continues to hold as support, the bias has shifted to the downside.
Bears may look to fade moves within Tuesday’s range on the assumption of a break below its low. The high-volume node (HVN) at 4576 could act as a magnet for prices and therefore a potential downside target. A break beneath this level brings the 200-day EMA into focus, just below the 4400 handle.
Source: COMEX, TradingView
View the full economic calendar
-- Written by Matt Simpson
Follow Matt on Twitter @cLeverEdge
How to trade with City Index
You can trade with City Index by following these four easy steps:
- Open an account, or log in if you’re already a customer
• Open an account in the UK
• Open an account in Australia
• Open an account in Singapore
- Search for the market you want to trade in our award-winning platform
- Choose your position and size, and your stop and limit levels
- Place the trade






