
The US dollar is showing signs of fatigue as markets increasingly price in peak geopolitical risk. With correlations across FX majors tightening and equities pushing higher, traders appear to be shifting back towards a risk-on mindset. That leaves the dollar vulnerable, particularly if tensions in the Middle East begin to ease.
Technically, the US dollar index is testing key support levels after breaking below its 200-day EMA, while USD/CHF offers one of the clearest bearish setups among major pairs.
View related analysis:
- US Dollar Index Outlook: Bullish Bounce Overshadowed by Major Top Risk
- FX Futures Positioning: USD, EUR, GBP, CAD | COT Report
- British Pound Price Action Setup: GBP/USD, EUR/GBP, GBP/JPY
- Gold Outlook: Rally Slows Near $5000 as Bearish Signals Build
US Dollar Weakens as Risk Appetite Returns, USD/CHF Near Breakdown
Traders continue to bet that we’ve seen peak uncertainty around the war in the Middle East, helping push Wall Street indices to fresh highs. That supports my view that the US dollar index formed an important top on March 31, and that any rebounds from recent losses are likely corrective in nature—offering opportunities for bears to fade.
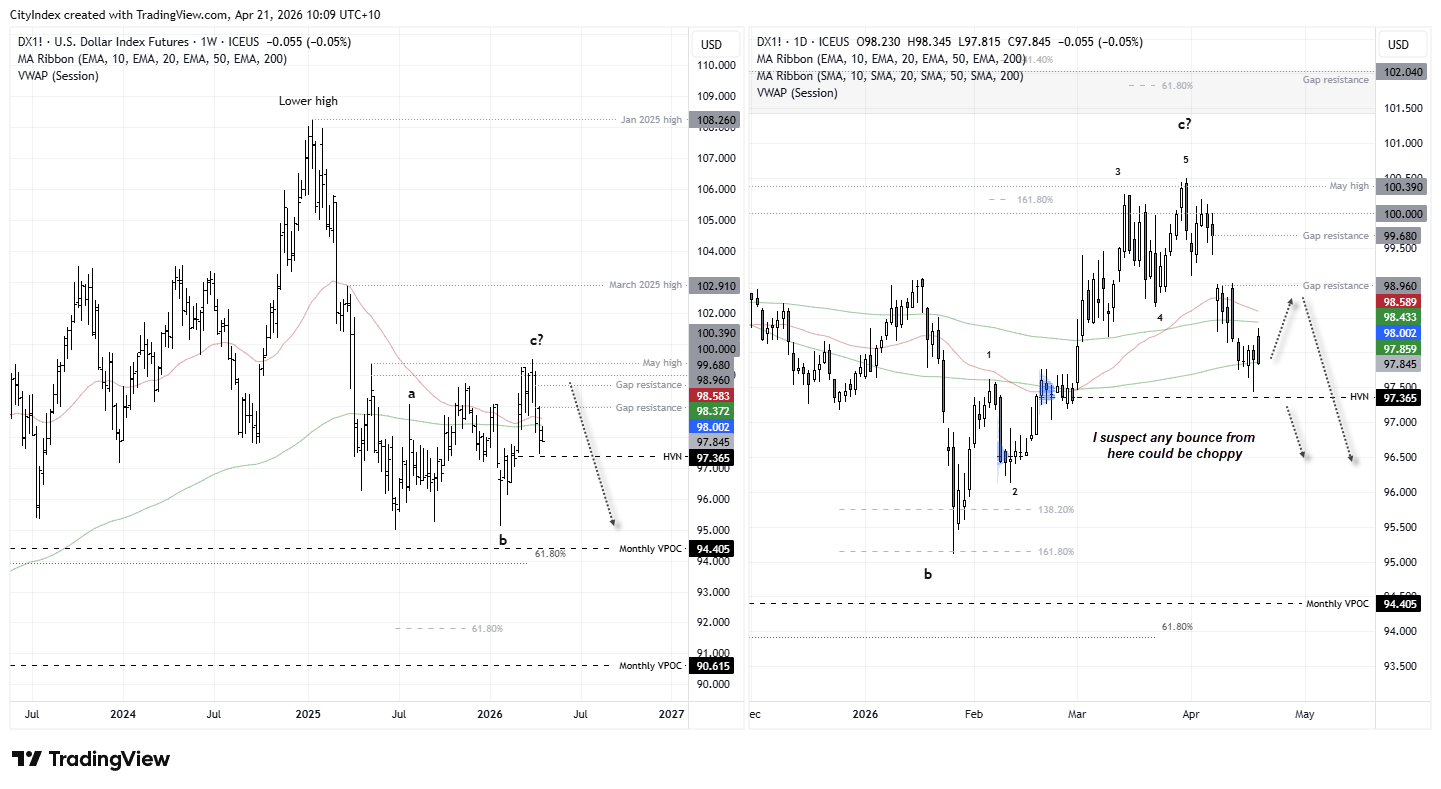
US Dollar: Corrective Bounce or Breakdown Below 97.36?
The US dollar index daily chart shows bearish momentum has returned below the 200-day EMA, with prices now probing the 200-day SMA. This suggests any bounce is unlikely to be clean or impulsive. The key question is whether we see a grinding, corrective rally towards the 98.96 gap resistance to form a prominent swing high, or a break below the 97.36 high-volume node (HVN).
The latter scenario likely requires some resolution to the conflict. Until then, support may continue to hold and any upside could remain choppy. Either way, I suspect we’ve already seen the end of the larger wave C and 5-wave impulsive move, leaving the path of least resistance skewed to the downside over time.
Source: ICE, TradingView
US Dollar Correlation Matrix
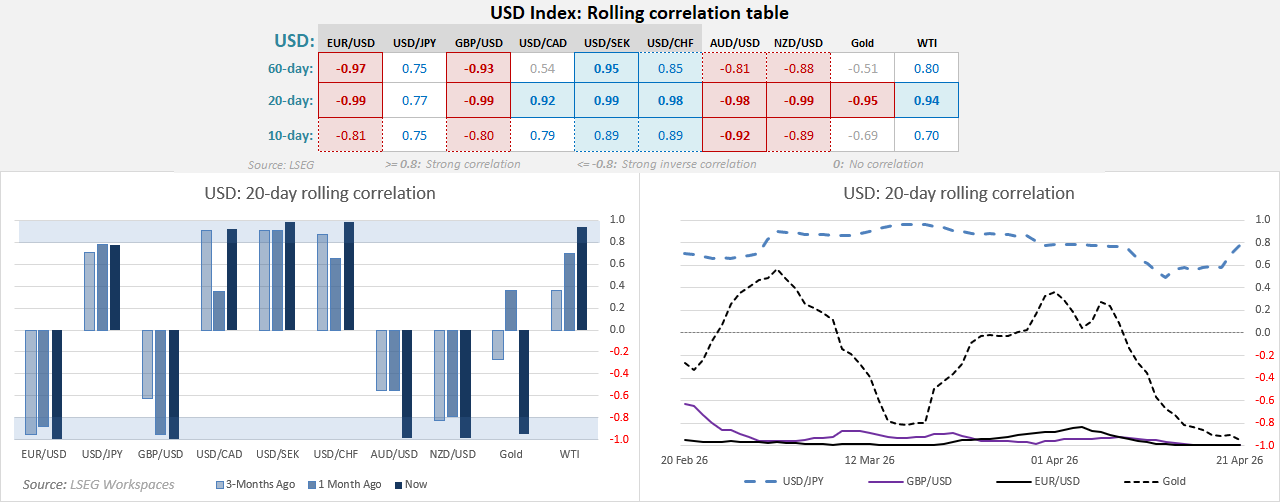
The correlation table compares the relationship between the US dollar index and major FX pairs, alongside gold and WTI crude oil. Correlations remain broadly strong across all three timeframes, reinforcing the USD’s dominant macro influence.
- However, the Japanese yen stands out as an outlier, with correlations around 0.75 across the 10–60 day windows—slightly weaker than typical levels, suggesting a more nuanced driver set (likely tied to yield differentials and Bank of Japan expectations).
- The Australian dollar currently shows the strongest inverse correlation over the past two weeks, with AUD/USD at -0.92, closely followed by NZD/USD at -0.89. This highlights how tightly antipodean currencies are tracking broader USD sentiment.
- Gold and crude oil correlations have softened over the past 10 days, which suggests geopolitical risk premia may be fading. This aligns with broader “risk-on” behaviour seen across equity markets.
- Notably, EUR/USD, GBP/USD and NZD/USD show near-perfect inverse correlations of around -0.99 over the past 20 days, underscoring how dominant USD flows have been in driving G10 FX.
- The Swiss franc also maintains consistently strong positive correlation via USD/CHF across all timeframes, reinforcing its role as a liquid counterweight to USD moves.
Ultimately, when correlations are this tight, it’s less about cross-currency stories and more about getting the USD right.
Source: LSEG

FX Majors Mixed as USD Weakness Persists, CAD Leads Gains
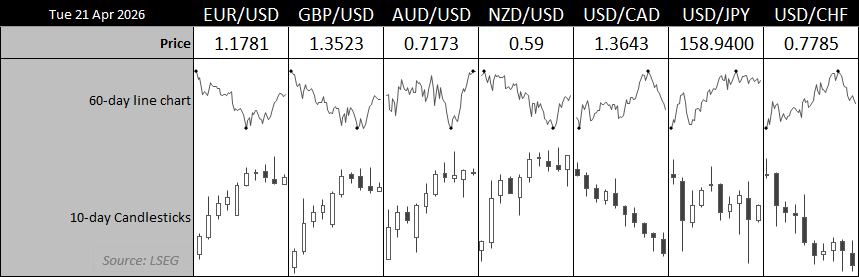
Looking across FX majors on the daily charts shows the Canadian dollar has been the strongest performer over the past two weeks.
- USD/CAD has fallen for nine of the past ten sessions. While clearly bearish, the lack of consolidation or retracement suggests it may be better suited to intraday setups rather than fresh swing trades.
- NZD/USD is carving out a potential swing low after New Zealand inflation surprised to the upside, increasing the likelihood of further RBNZ tightening.
- AUD/USD printed what could be interpreted as either a bullish hammer or hanging man on Monday. However, after a strong rally and Friday’s shooting star reversal, NZD/USD appears the more attractive bullish setup, with AUD/USD likely to remain choppy.
- EUR/USD is in a similar position to AUD/USD—extended after a strong move and now showing signs of hesitation near recent highs.
- GBP/USD is pulling back more gently and may offer a slight edge for bulls relative to EUR/USD.
Overall, USD/CHF continues to offer the clearest price action for a near-term bearish USD setup.
Source: LSEG

USD/CHF Technical Analysis: US Dollar vs Swiss Franc
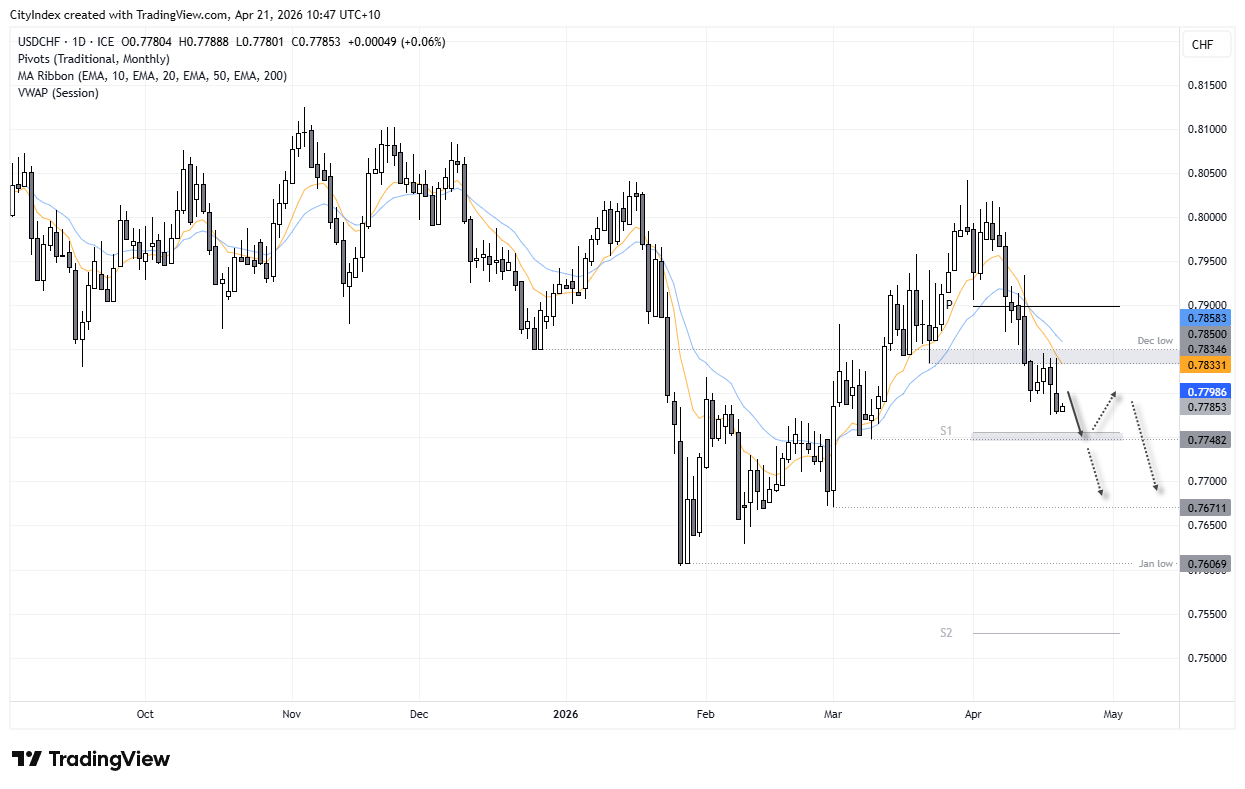
While correlations between FX majors and the US dollar index remain tight overall, price action in the Swiss franc appears cleaner for USD bears.
The USD/CHF daily chart shows the downtrend began on March 31, with a shooting star marking a false break above 0.80. A bearish engulfing candle on April 13 then drove prices below the monthly pivot point—a level yet to be retested. Since then, USD/CHF has printed a lower high and is now hovering just beneath the cycle lows.
Bears may look to fade rallies towards the December low (0.7850), anticipating a move towards the monthly S1 near the 0.7748 swing low. A break below there brings 0.77 and 0.7671 into focus, which would likely coincide with a broader USD selloff—potentially driven by easing geopolitical tensions in the Middle East.
Source: NYMEX, TradingView
View the full economic calendar
-- Written by Matt Simpson
Follow Matt on Twitter @cLeverEdge
How to trade with City Index
You can trade with City Index by following these four easy steps:
- Open an account, or log in if you’re already a customer
• Open an account in the UK
• Open an account in Australia
• Open an account in Singapore
- Search for the market you want to trade in our award-winning platform
- Choose your position and size, and your stop and limit levels
- Place the trade