
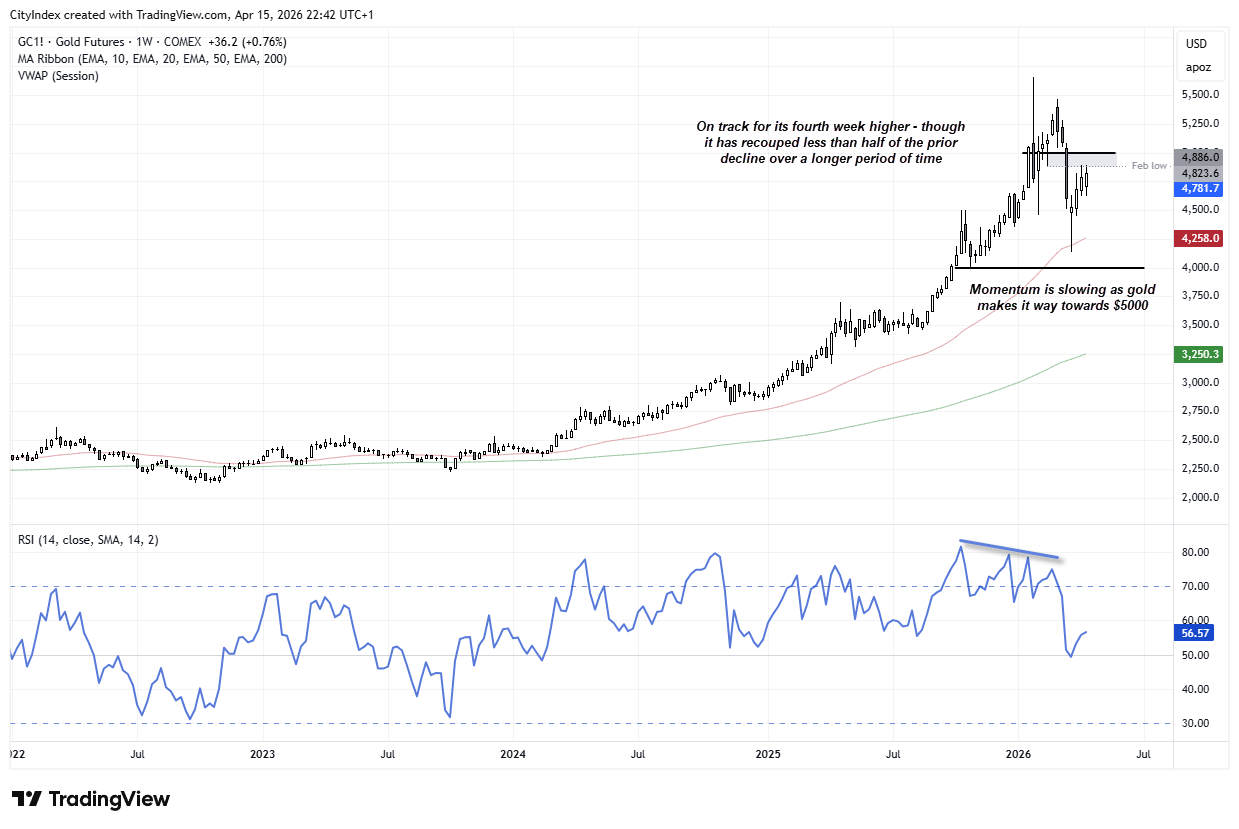
Gold is on track for its fourth week higher. Yet when you consider that it has taken longer to recoup less than half of its recent declines, I cannot help but wonder if gains could be limited from here – or a pullback is on the horizon.
View related analysis:
- Crude Oil Forecast: Oil Caught Between Supply Shock and De-Escalation Bets
- Japanese Yen Price Action Setups: USD/JPY, AUD/JPY, CHF/JPY
- AUD/USD Outlook 2026: Key Drivers for the Australian Dollar in Q2
Gold Futures (GC) Technical Analysis
Gold rally stalls below February low as momentum fades near $5000
We’ve not seen a record high for gold since late January, and it has since fallen by as much as -27%, briefly entering a technical bear market. However, after finding support at its 50-week EMA, gold bulls have staged an 18% rebound and are currently on track for a fourth consecutive weekly gain.
Even so, the recovery has been relatively slow—prices have yet to retrace half of the prior decline—and momentum appears to be fading. That should give bulls reason for caution, especially as gold grinds its way towards 5000. It’s also worth noting that this week’s high has so far stalled around the February low.
Source: COMEX, TradingView

Gold forms potential double top as momentum weakens near 5000
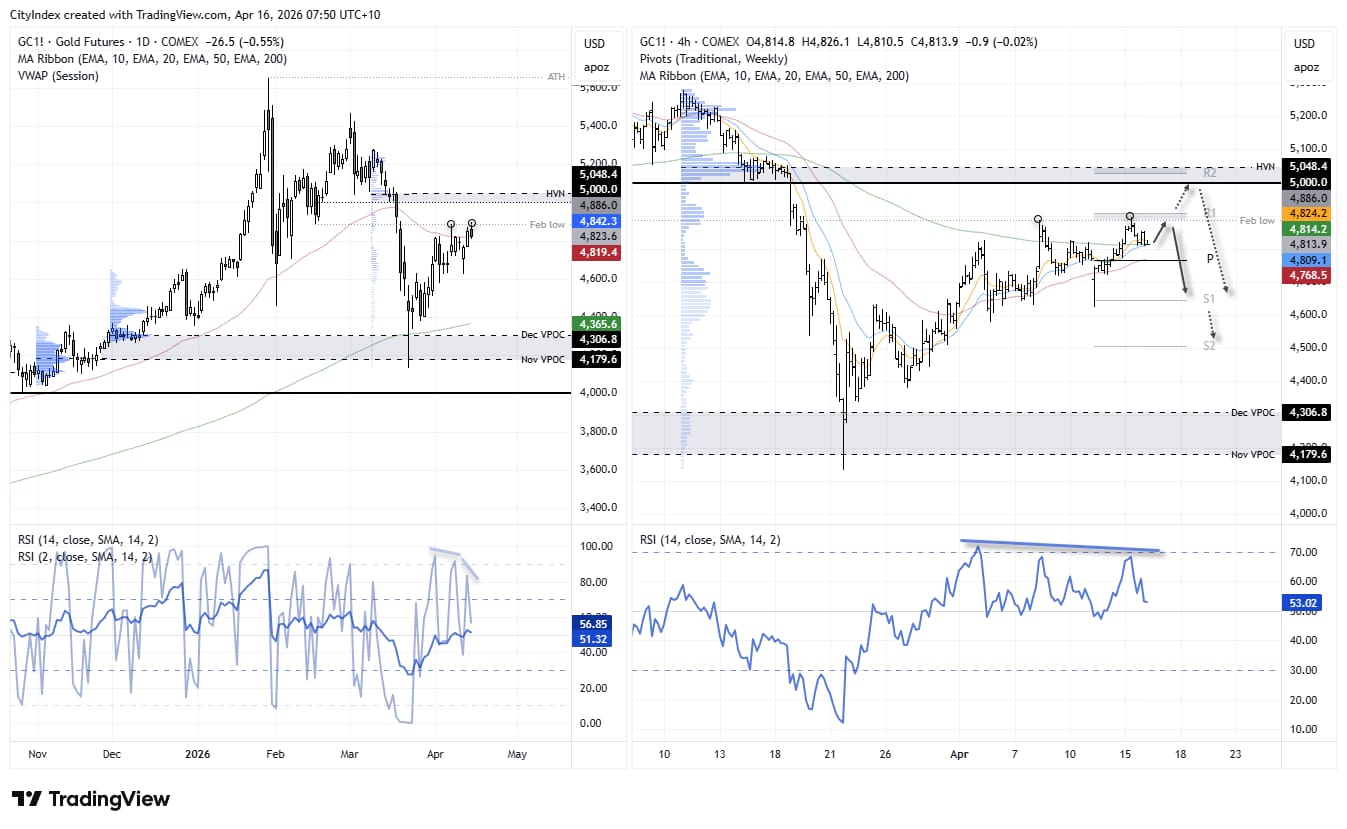
The daily chart shows a potential double top around the February low (4842), with Wednesday’s small bearish candle also stalling near the 50-day EMA. A mild bearish divergence is present on RSI (2), while RSI (14) is threatening to slip back below 50 to signal fading momentum.
While a break higher cannot be ruled out, I suspect we’re nearing a top—whether that forms around current levels or slightly higher towards the 5000 handle and the 5048 high-volume node (HVN).
Source: COMEX, TradingView
The 4-hour chart shows the potential double top is also forming near the weekly R1 pivot point. Prices have already dipped lower and are now resting around a cluster of moving averages, so a minor bounce may be due from current levels.
- I suspect bears may look to fade moves towards Wednesday’s high in anticipation of another leg lower towards the weekly pivot point at 4766. A break beneath that level brings weekly S1 and the 4600 low into focus.
- A break above the weekly R1 (4908) invalidates the near-term bearish bias and brings 5,000 into focus.
- I would then seek evidence of a swing high around 5,000, given the significance of that level as likely resistance.
Gold Futures (GC) Positioning | COT Report
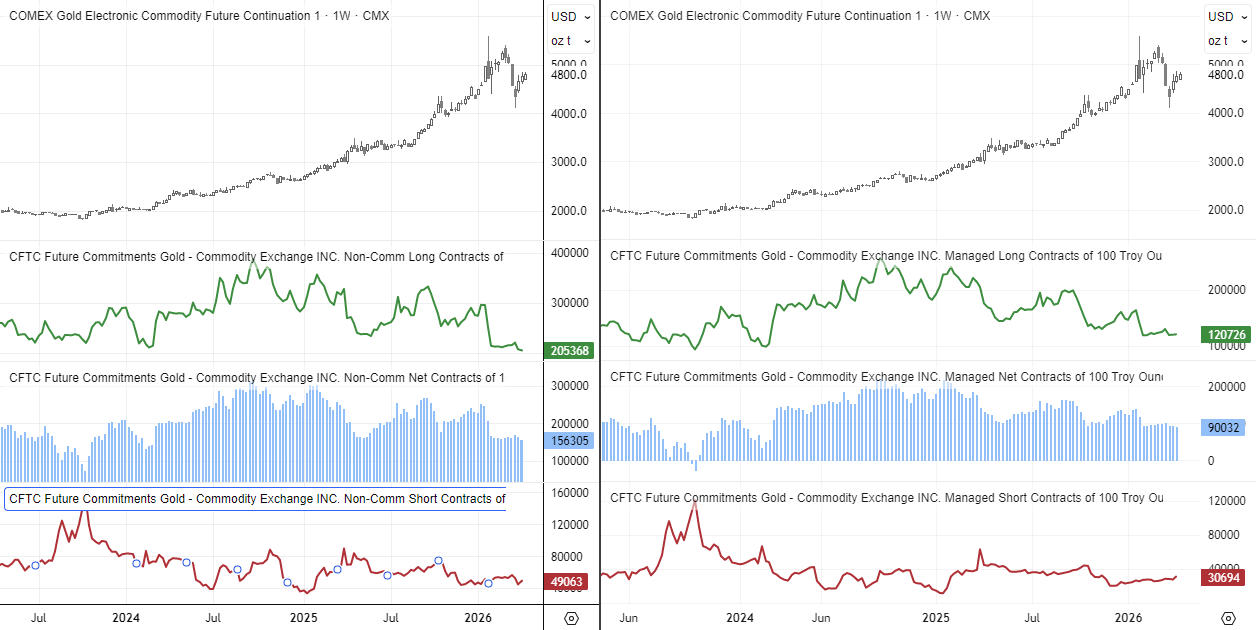
Net-long exposure to gold futures fell for a second week among large speculators and a third among asset managers. Regardless, net-long positioning has been trending lower for some time, despite strong gains into the end of 2025.
What’s worth noting is that gross shorts among asset managers have been gradually increasing since December, and picked up again last week among large speculators. While the rise in shorts is hardly enough to turn sentiment outright bearish, it does align with the view that gold may be nearing an inflection point that could favour bears.
Source: CFTC (COT), COMES, LSEG
View the full economic calendar
-- Written by Matt Simpson
Follow Matt on Twitter @cLeverEdge
How to trade with City Index
You can trade with City Index by following these four easy steps:
- Open an account, or log in if you’re already a customer
• Open an account in the UK
• Open an account in Australia
• Open an account in Singapore
- Search for the market you want to trade in our award-winning platform
- Choose your position and size, and your stop and limit levels
- Place the trade