
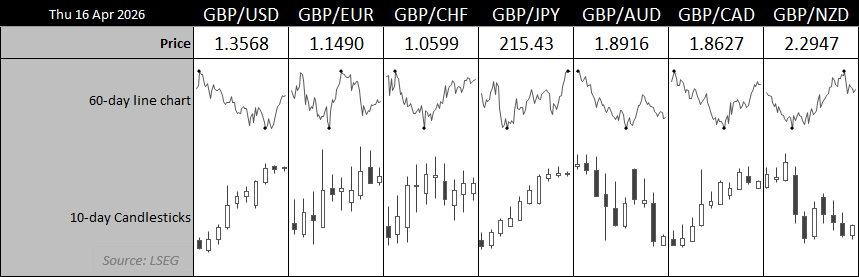
The British pound has been one of the stronger performers in recent sessions, with GBP/USD extending higher from its cycle low while EUR/GBP and GBP/JPY present diverging technical setups.
GBP/USD remains supported by a steady uptrend, EUR/GBP is attempting to carve out a bullish continuation pattern, and GBP/JPY is flashing early signs of exhaustion at elevated levels. Together, these charts highlight a market that is still constructive for sterling—but not without pockets of risk.
View related analysis:
- Gold Outlook: Rally Slows Near $5000 as Bearish Signals Build
- Japanese Yen Price Action Setups: USD/JPY, AUD/JPY, CHF/JPY
- AUD/USD Outlook 2026: Key Drivers for the Australian Dollar in Q2
Source: LSEG
British Pound Outlook: Momentum Builds, But Cracks Are Emerging
GBP/USD Technical Analysis: British Pound vs US Dollar
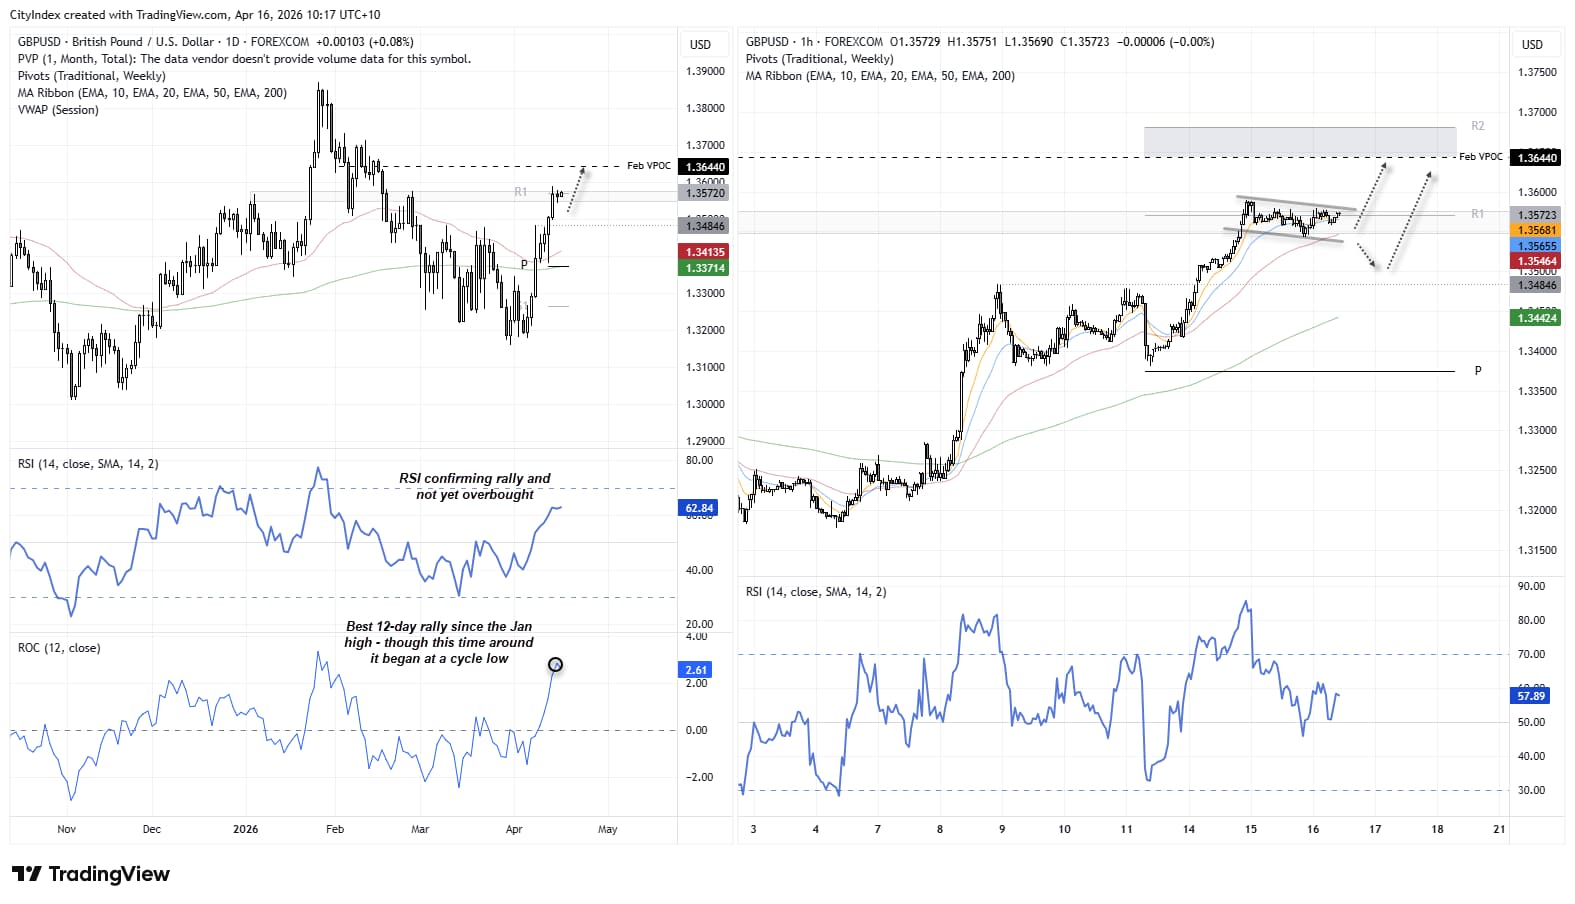
Sterling bulls have enjoyed a strong rally over the past two weeks, with GBP/USD rising 3.3%. Notably, this marks the best 12-day performance since the January high. However, the key difference this time is that the surge began from a cycle low, rather than at the tail end of an established trend. Moreover, the daily RSI (14) is not yet overbought, and no bearish divergence has formed.
The 1-hour chart shows a strong uptrend holding above its 50-bar EMA, despite entering a period of consolidation. As is typical, trends pause along the way, which could allow traders to wait for a better entry rather than chasing momentum.
- With the trend behind them, bulls could seek evidence of swing lows around support if a pullback occurs, or wait for a breakout above the current consolidation.
- The February VPOC (volume point of control) at 1.3644, along with the monthly R2 just below the 1.37 handle, are potential upside targets for bulls.
Source: Forex.com, TradingView

EUR/GBP Technical Analysis: Euro vs British Pound
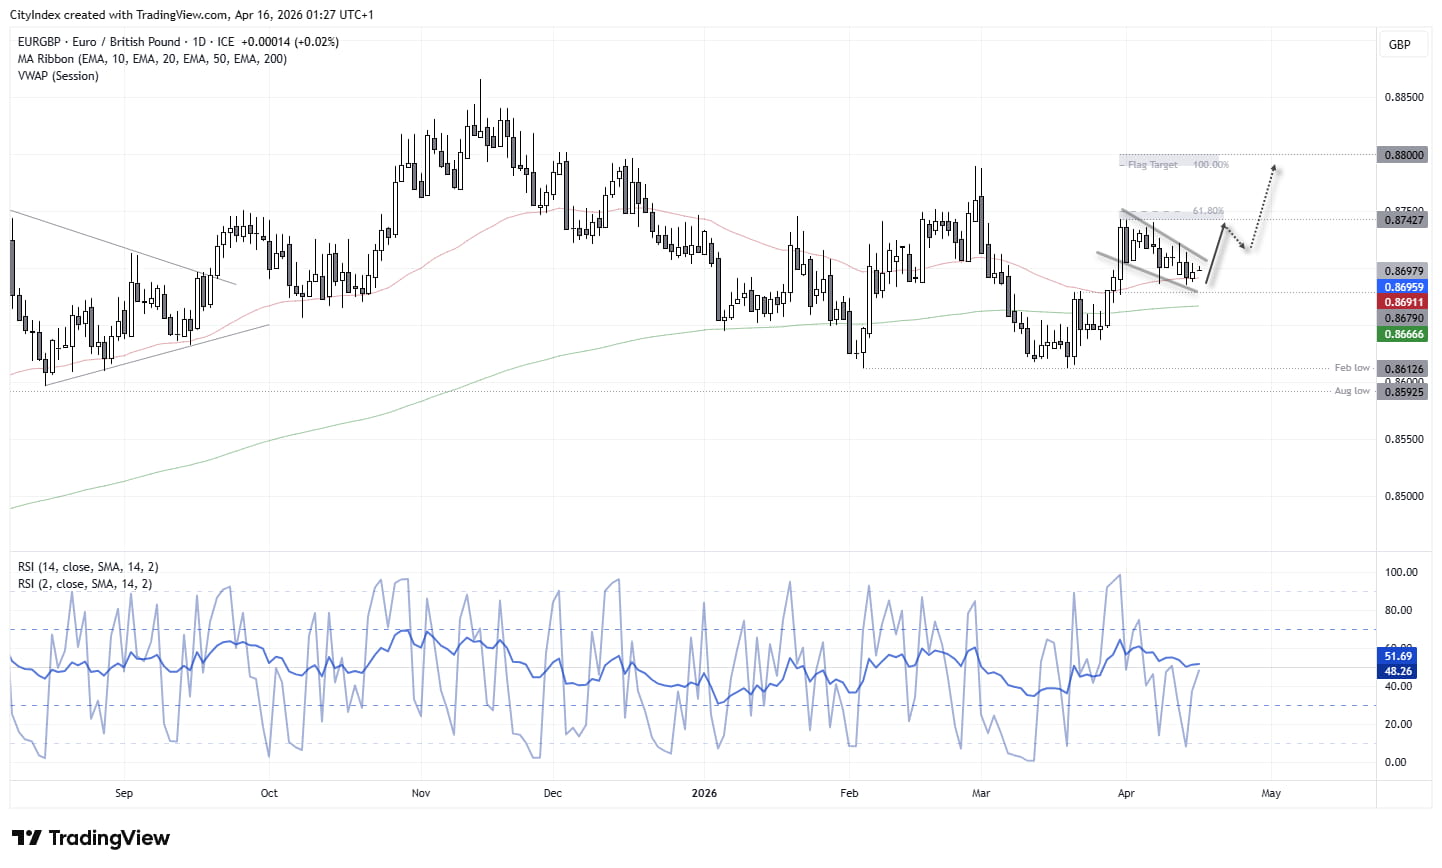
A potential bull flag may be forming on the EUR/GBP daily chart. The rally began in March after finding support around the February low. Prices have since entered a two-week retracement, with its bearish tilt and overlapping candles suggesting a bull flag could be taking shape.
Admittedly, bull flags forming within strong uptrends are generally preferred and considered higher probability, as they tend to meet or exceed their projected targets more often. However, that does not mean bull flags within less established trends cannot play out—though bulls may wish to adopt more conservative upside targets.
- A 61.8% Fibonacci projection lands just above the cycle highs, making the 0.8740 area a potential upside target for EUR/GBP bulls.
- A break above this level brings the 100% flag target into view, just beneath the 0.88 handle.
Source: ICE, TradingView

GBP/JPY Technical Analysis: British Pound vs Japanese Yen
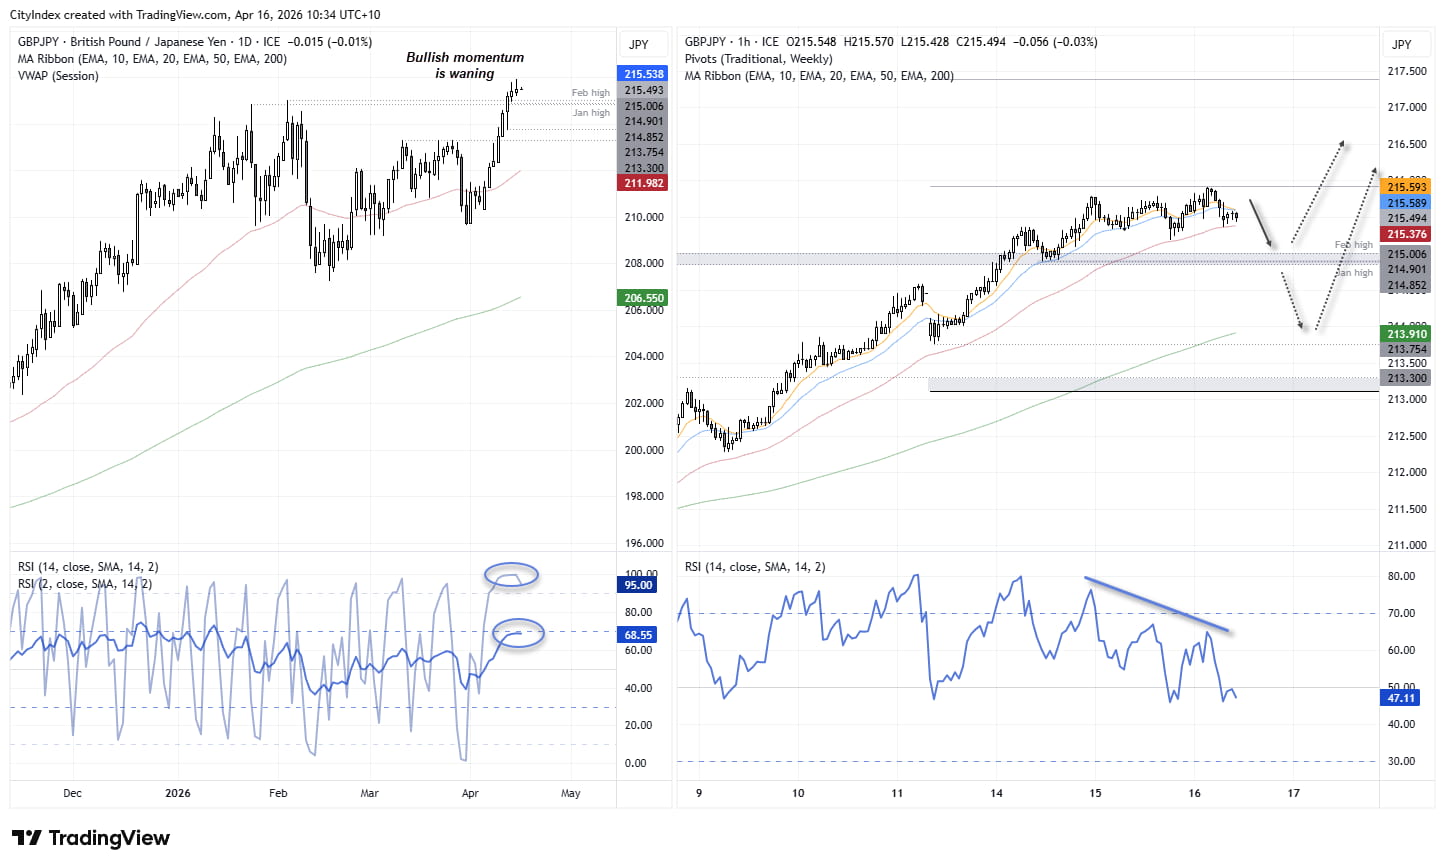
We’ve seen another strong rally on GBP/JPY this month, pushing the cross to an 18-month high. However, bullish momentum appears to be waning on the daily chart. The RSI (2) has spent several days in overbought territory, while the RSI (14) is close to following. I am not calling for a major reversal, but with volatility diminishing at multi-month highs after a strong advance, a period of mean reversion could be due.
The 1-hour chart shows that yesterday’s high respected the weekly R1 pivot. An established bearish RSI divergence has also formed.
- Bears could either seek evidence of a swing high below the cycle high, anticipating a pullback, or wait for a breakout of a bearish continuation pattern—such as a triangle or pennant—on lower timeframes.
- The January and February highs around 215 form a likely support zone, which could act as an initial downside target or an area to monitor for a potential swing low.
- Pullback or not, dips are likely to remain favourable for bulls while GBP/JPY holds above 213.
Source: ICE, TradingView
View the full economic calendar
-- Written by Matt Simpson
Follow Matt on Twitter @cLeverEdge
How to trade with City Index
You can trade with City Index by following these four easy steps:
- Open an account, or log in if you’re already a customer
• Open an account in the UK
• Open an account in Australia
• Open an account in Singapore
- Search for the market you want to trade in our award-winning platform
- Choose your position and size, and your stop and limit levels
- Place the trade