



The US dollar index may be due a near-term bounce, but the bigger picture is beginning to tilt bearish. A completed wave structure and fading momentum suggest a major top could already be in place, with traders toying with the idea of Fed cuts rather than hikes.
View related analysis:
- US Dollar Outlook: Bearish April Seasonality Meets Middle East Wildcard
- Gold Outlook: Rally Slows Near $5000 as Bearish Signals Build
- British Pound Price Action Setup: GBP/USD, EUR/GBP, GBP/JPY
- Crude Oil Forecast: Oil Caught Between Supply Shock and De-Escalation Bets
US Dollar Index Outlook: Bearish Reversal Signals Hints at Major Top
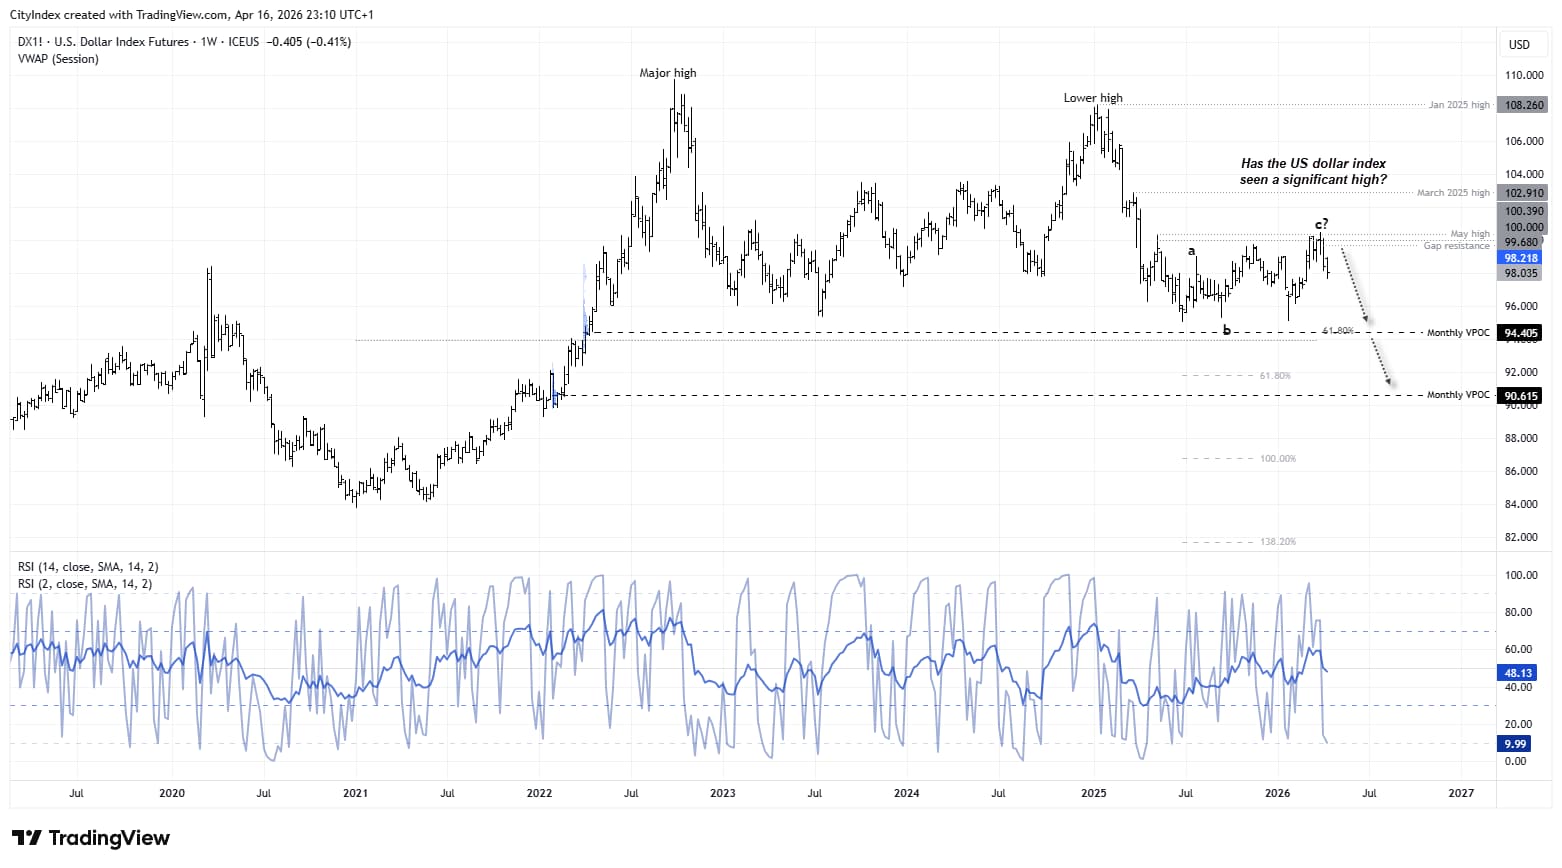
My outlook for the US dollar index has played out relatively well over the past couple of months, though it now needs revising following the bearish reversal before prices could reach my upper targets around 101.50–102.
I had projected that higher target on the assumption the US dollar index was in a fifth wave of a 5-wave impulsive rally, which could also have marked the end of a larger degree wave C. That latter point is key, because if correct it would signal a major turning point lower for the US dollar.
Yet it now appears we may have already seen the end of that fifth wave—and the larger wave C. If so, it suggests the US dollar formed a significant top on March 31.
For this scenario to fully play out, we likely need some resolution to tensions between the US and Iran. If Middle East geopolitics move to the back burner, it would allow traders to refocus on the prospect of Fed cuts—and effectively kill off any remaining bets of a hike.
Source: ICE, TradingView

US Dollar Index Daily Chart: Oversold Bounce Meets Key Resistance Zone
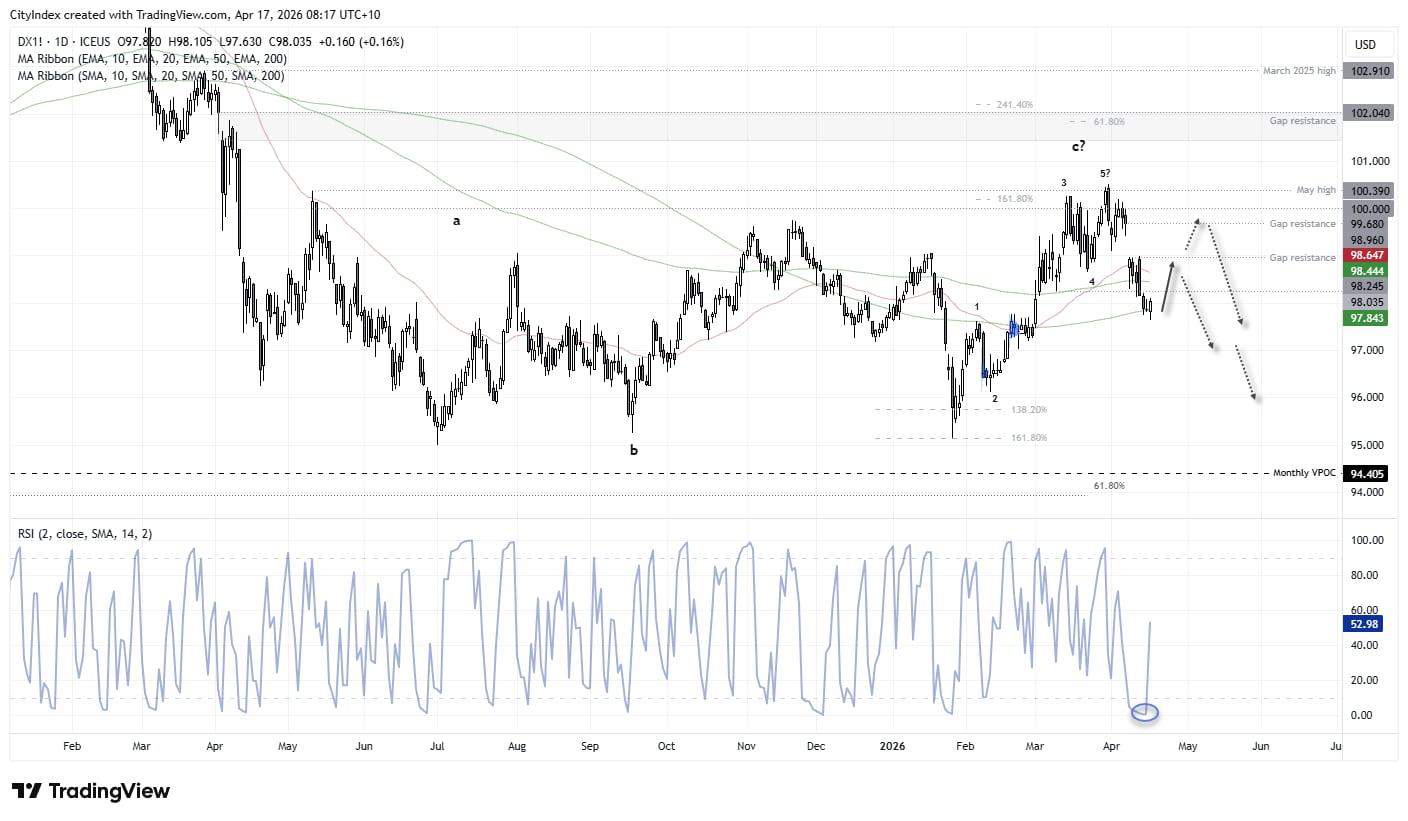
The daily chart shows a five-wave rally, although the fifth wave is relatively short. Still, it marked a false break above the prior swing high, and momentum has since clearly turned lower. This supports the view that a major reversal may be underway.
However, a small bullish outside day formed on Thursday around the 200-day SMA, while the daily RSI (2) was deeply oversold. This suggests the US dollar could be due at least a minor leg higher in the near term.
That said, with the 200-day EMA (98.44), gap resistance levels (98.24, 99.68), and the 100 handle looming above, there are plenty of resistance levels for bulls to test—or for bears to watch for signs of a swing high to rejoin a broader bearish move.
Source: ICE, TradingView

FX Majors Signal Near-Term US Dollar Bounce
The bullish outside day on the US dollar index has been accompanied by several reversal signals across FX majors, reinforcing the case for a near-term bounce. This carries more weight than a standalone EUR/USD signal.
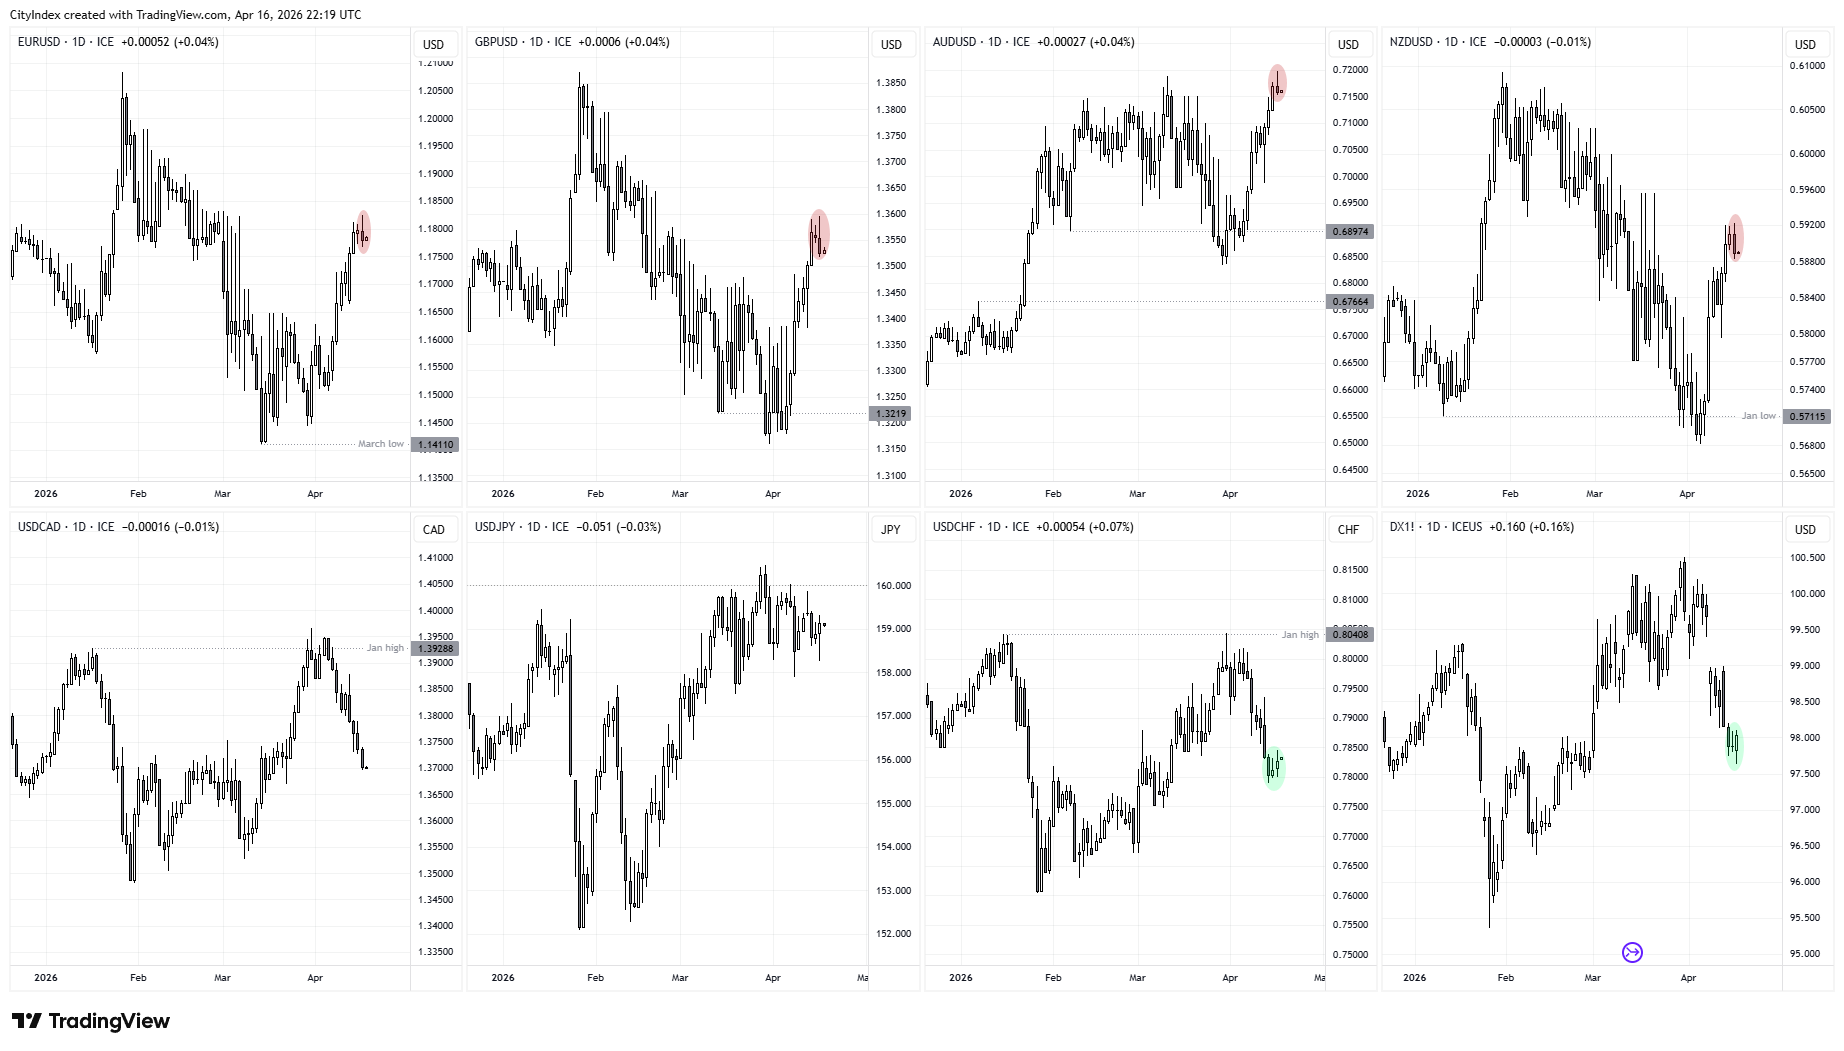
- EUR/USD formed a bearish outside day with an upper wick around 1.18. However, given the strong prior momentum, this alone does not signal a deep pullback unless broader conditions shift.
- GBP/USD also formed a bearish outside day—larger than the euro’s. Like EUR/USD, the strength of the prior rally means it may take time to determine whether the pullback is shallow or more sustained.
- AUD/USD printed a small shooting star. Arguably the more constructive bullish case for USD, given it recently broke above its March high, although RBA hike expectations could limit downside.
- NZD/USD formed a bearish engulfing (outside day) and appears the cleaner short candidate relative to AUD/USD, as its rally has lagged the Aussie.
- USD/CAD has continued lower, with the Canadian dollar gaining traction. With no immediate sign of a base, further downside cannot be ruled out.
- USD/CHF formed a morning star reversal. A long bias here is supported by the SNB’s preference for a weaker Swiss franc.
View the full economic calendar
-- Written by Matt Simpson
Follow Matt on Twitter @cLeverEdge
How to trade with City Index
You can trade with City Index by following these four easy steps:
- Open an account, or log in if you’re already a customer
• Open an account in the UK
• Open an account in Australia
• Open an account in Singapore
- Search for the market you want to trade in our award-winning platform
- Choose your position and size, and your stop and limit levels
- Place the trade






