



Wall Street’s rally remains impressive on the surface, but cracks may be emerging beneath record highs. Nasdaq 100 futures continue to lead gains, while the Dow Jones struggles to keep pace and flashes bearish technical signals near key resistance levels.
View related analysis:
- AUD/USD Bear Case Builds as AUD/NZD Signals Top, GBP/AUD Eyes Rebound
- British Pound Outlook: GBP/USD, GBP/AUD Tease Bears, EUR/GBP Rebounds
- FX Futures Positioning: Dollar Rebound Stalls as Yen Bears Return | COT Report
- Crude Oil Outlook: Brent Teases Bears at Elevated Prices
- How to Read the COT Report to Track Forex Market Sentiment
Nasdaq 100 Rally Slows While Dow Jones Flashes Bearish Signals on Wall Street
Trying to pick a market top on US indices tends to end in frustration for many bears, because Wall Street traders remain among the most optimistic in the world. The sharp swing low formed in late March is testament to how quickly appetite for risk can return, despite war continuing to rage across the Middle East.
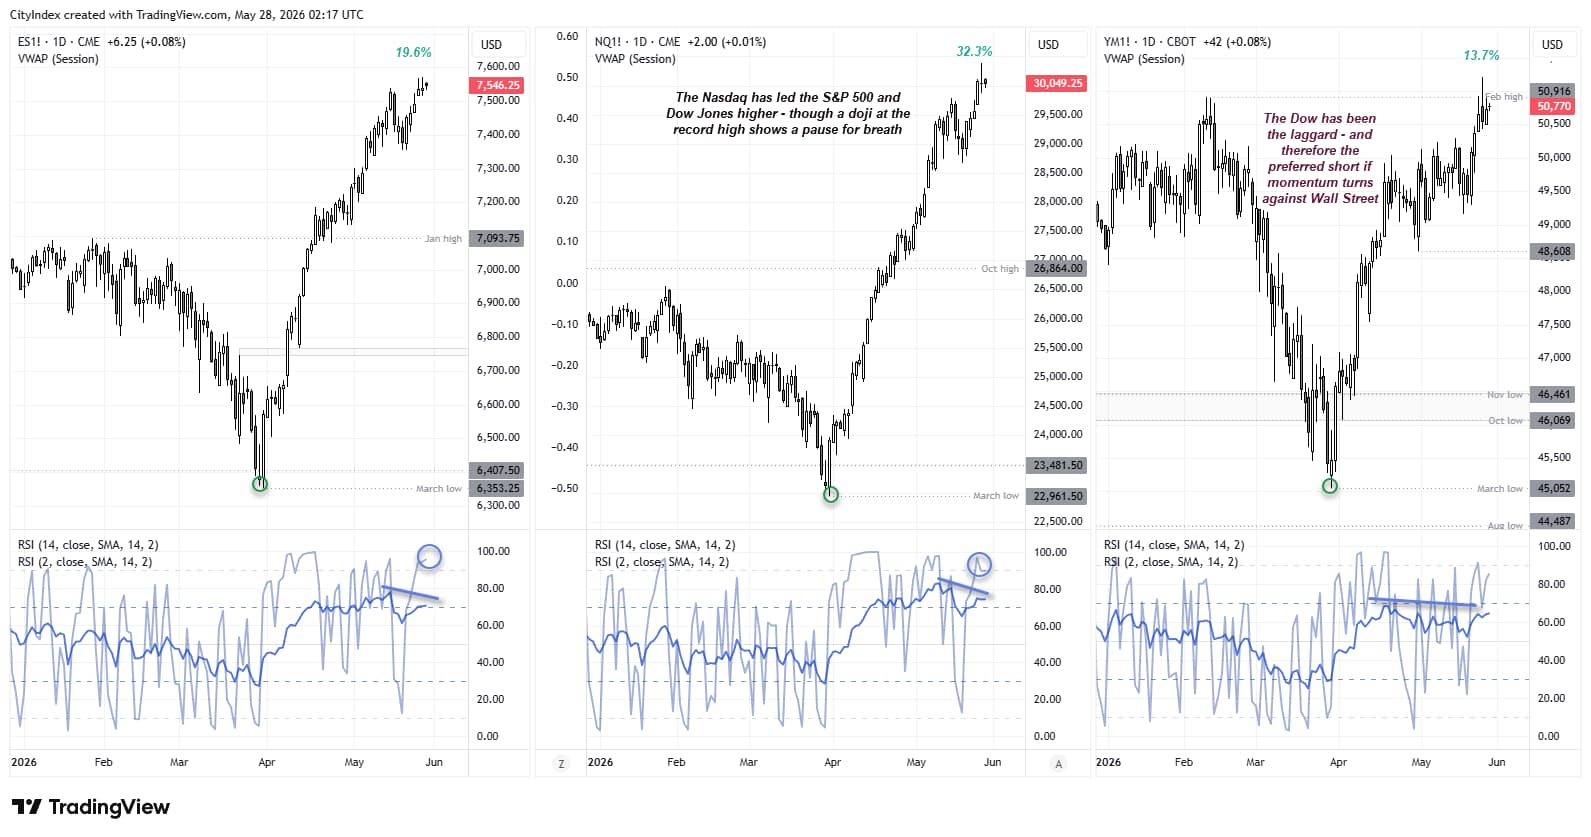
Yet not all rallies are equal. Nasdaq 100 futures have rallied more than 30% since the March 31 low, while S&P 500 futures have gained close to 20%. Both indices also broke to fresh record highs around two weeks earlier, leaving the Dow Jones trailing behind. Dow futures have rallied just 13% from their late-March low, yet only managed a marginal record high on Tuesday — a full five weeks after its peers reached new highs. Moreover, the Dow has risen less than 5% since the S&P 500 and Nasdaq broke into record territory.
That leaves the Dow Jones as my preferred vehicle to short Wall Street, should sentiment begin to deteriorate. And there are tentative signs it just might.
Source: ICE, TradingView
Bearish Signals Emerge Across Wall Street Indices
- S&P 500 futures have formed two small shooting star candles at record highs, while a bearish divergence has formed on the RSI (14) and the RSI (2) remains in overbought territory.
- A wide-legged Rickshaw Man doji formed on Nasdaq futures at a record high on Wednesday, with similar bearish signals appearing on both RSI indicators.
- Meanwhile, Dow Jones futures have faltered around their February high, which is hardly setting the world alight from the bulls’ perspective.

Dow Jones Futures (YM) Technical Analysis
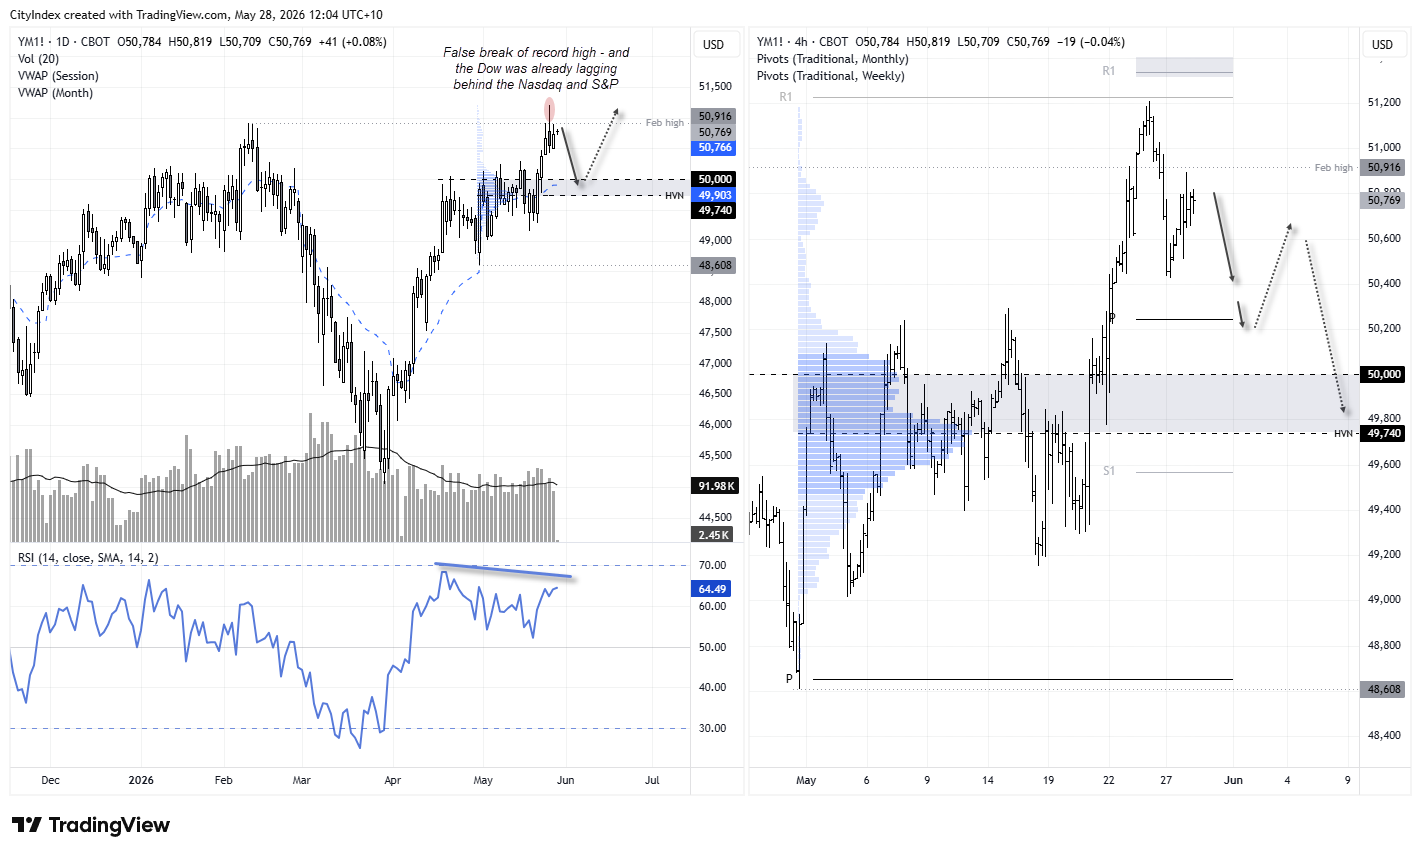
Unlike the Nasdaq and S&P 500, bulls have struggled to sustain record highs on the Dow Jones futures market. The Dow has been the laggard of the three indices since the April lows, with the Nasdaq and S&P 500 reaching fresh record highs by mid-April, while the Dow only briefly touched a record high intraday on Wednesday.
Tuesday’s candle formed an upper wick above the prior high, yet the open-to-close range beneath the February high accounted for less than half of the day’s total range, leaving a wide-bodied shooting star candle. Volumes were also higher during the final hours of trade, suggesting bears have remained in control since the recent fall from grace.
With a false breakout at a record high from a lagging index, perhaps the Dow Jones is on the cusp of a pullback. Note that the monthly VWAP sits just below 50,000, making the milestone level a potential near-term target for bears.

Dow Jones Futures Bearish Setup Eyes 50,000
The 4-hour chart shows prices have retraced back towards the February high, while volatility has picked up beneath that key resistance level. If a swing high has not already formed, it may be close. Bears could fade rallies towards 51,000, with a move towards the weekly pivot point near 50,200 and the 50,000 handle in focus.
Source: ICE, TradingView
View the full economic calendar
-- Written by Matt Simpson
Follow Matt on Twitter @cLeverEdge
How to trade with City Index
You can trade with City Index by following these four easy steps:
- Open an account, or log in if you’re already a customer
• Open an account in the UK
• Open an account in Australia
• Open an account in Singapore
- Search for the market you want to trade in our award-winning platform
- Choose your position and size, and your stop and limit levels
- Place the trade






