

Nasdaq stalls near 30,500 while Bitcoin tests key multi-month support amid mixed market sentiment and growing liquidity concerns as geopolitical tensions in the Middle East show signs of exhaustion heading into the summer season.
Bullish momentum across U.S. indices remains broadly intact despite overbought conditions and emerging bearish divergences across momentum indicators. However, signs of slowing upside momentum are beginning to emerge as geopolitical tensions re-escalate in parts of the Middle East and investors assess the potential impact of the upcoming SpaceX IPO, which could become the largest IPO in history. Such an event may temporarily absorb market liquidity, particularly as markets approach the seasonally thinner liquidity conditions often associated with the summer months.
U.S. Non-Farm Payrolls are also due this week, followed by inflation data next week and the subsequent FOMC outlook. These releases are likely to play a critical role in shaping market expectations as the economic implications of U.S. involvement in Middle East developments continue to unfold. While this backdrop appears to be capping sentiment across cryptocurrency markets, U.S. equities have so far remained relatively resilient.
Key Market Themes
- Bitcoin tests multi-month support near $72,000.
- Nasdaq challenges record highs near 30,500.
- Liquidity risks rise ahead of major economic data and the anticipated SpaceX IPO.
Bitcoin Outlook: Daily Time Frame – Log Scale
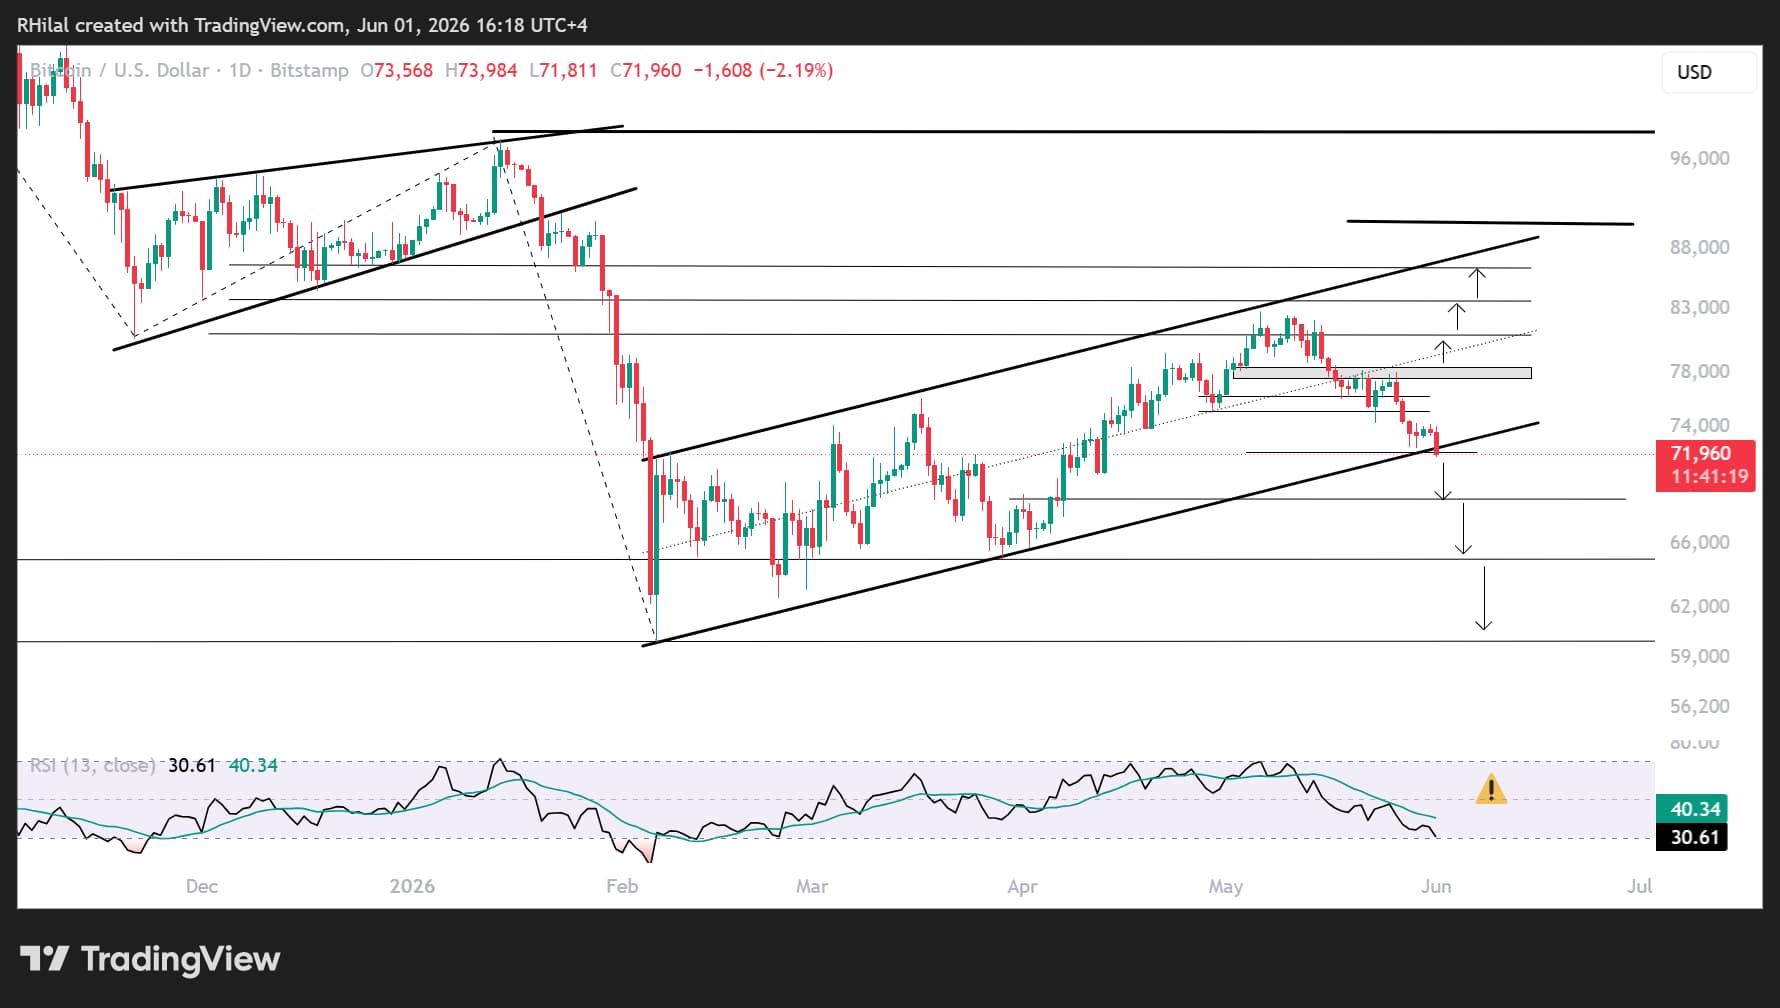
Source: TradingView
Bitcoin price action has continued to trade within a rising channel following this year's low near $60,000. The cryptocurrency is now testing the lower boundary of that channel as bearish momentum accelerates near the $72,000 level, creating a critical inflection point that could either present another dip-buying opportunity or confirm a broader bearish continuation from the October 2025 highs.
Bullish Scenario for Bitcoin
A sustained recovery back above the channel midpoint near $78,000 would reinforce the bullish bias established from the $60,000 low and could expose a retest of the channel's upper boundary near $84,000–$86,000. A successful test of this zone would help assess the sustainability of the broader bull market before another potential attempt above the $100,000 mark.
Bearish Scenario for Bitcoin
A breakdown below $72,000 would increase bearish risks and expose support levels near $68,000, $65,000, and $58,000, which may attract dip-buying interest once again. However, a sustained break below $58,000 would raise the risk of a deeper decline toward $48,000 before creating another long-term bullish positioning opportunity, as daily momentum dips to yearly oversold levels.
Nasdaq Outlook: 3-Day Time Frame – Log Scale
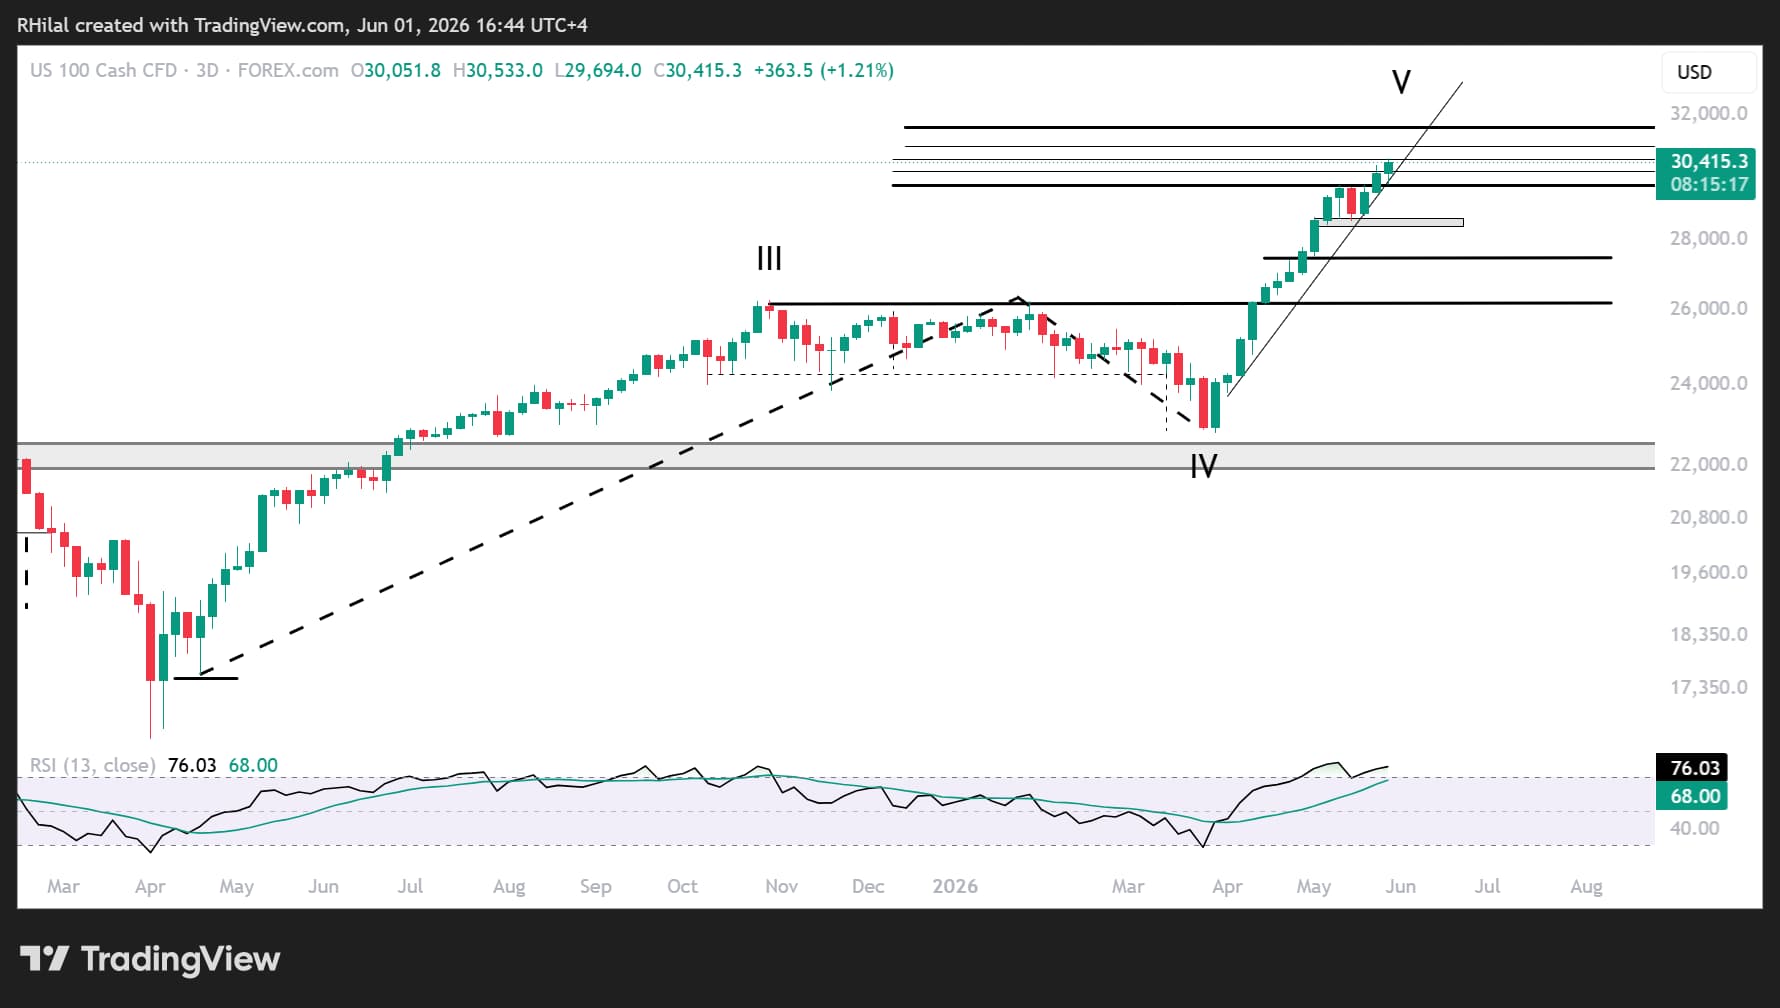
Source: TradingView
Bullish Scenario for Nasdaq
A sustained hold above 30,500 would expose further upside toward 30,900 and 31,500 before another potential corrective drawdown develops following the steep rally. The 31,500 level aligns with the 100% Fibonacci extension of the April 2025 – October 2025 – March 2026 cycle and remains the higher-probability candidate for the next major resistance zone.
Bearish Scenario for Nasdaq
Failure to reclaim and sustain trade above the previously respected resistance zones near 29,700 and 31,500 would increase downside risks toward 28,700 and 28,400, where dip-buying opportunities may emerge in line with the prevailing trend.
Should these support levels fail to hold, a deeper correction could expose another 1,000-point decline toward 27,400. This level aligns with key Fibonacci retracement ratios of the March–May 2026 impulse move, including the 23.6%, 27.2%, and 38.2% retracement levels.
A more extreme bearish scenario would target the upper boundary of the 2025–2026 consolidation range near 26,200. This area remains an attractive long-term accumulation zone and a potential dip-buying opportunity should a sharper correction emerge from recent highs.
Written by Razan Hilal, CMT
Follow on X: @Rh_waves