



The ASX 200 is hovering just below 9000, with price action showing signs of fatigue near the highs. But beneath the surface, strength in the tech sector suggests this remains a market where traders are likely to buy dips, even as a short-term pullback or consolidation unfolds.
View related analysis:
- ASX 200 Outlook: Futures Rebound Tests Key Resistance as Volatility Rises
- British Pound Price Action Setup: GBP/USD, EUR/GBP, GBP/JPY
- US Dollar Index Outlook: Bullish Bounce Overshadowed by Major Top Risk
- Gold Outlook: Rally Slows Near $5000 as Bearish Signals Build
ASX 200 Forecast: Tech Strength Meets Resistance Near 9000
ASX 200 Market Snapshot
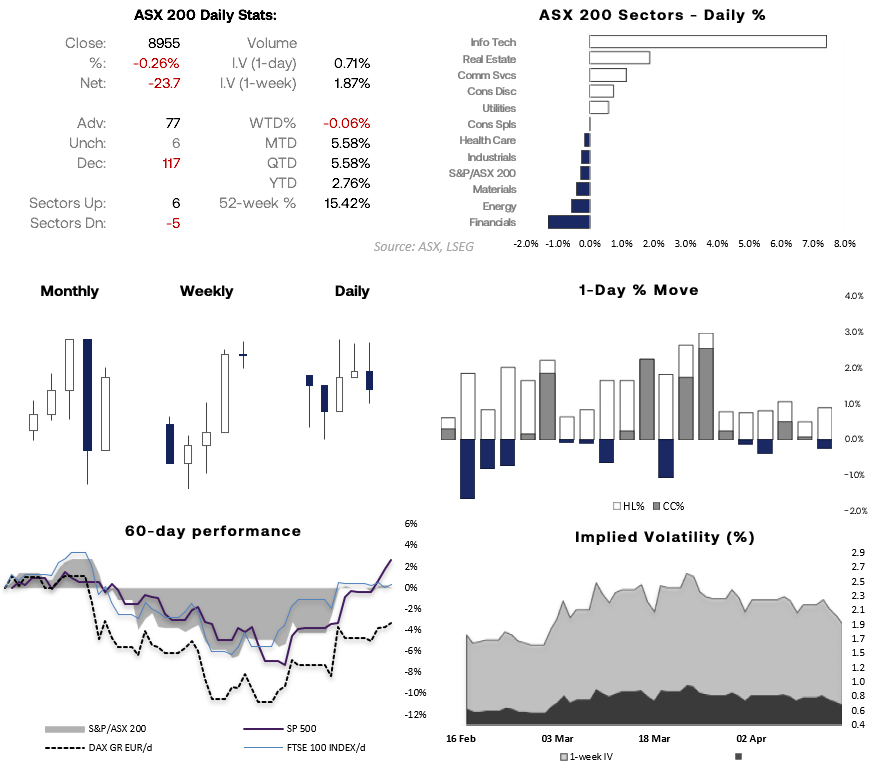
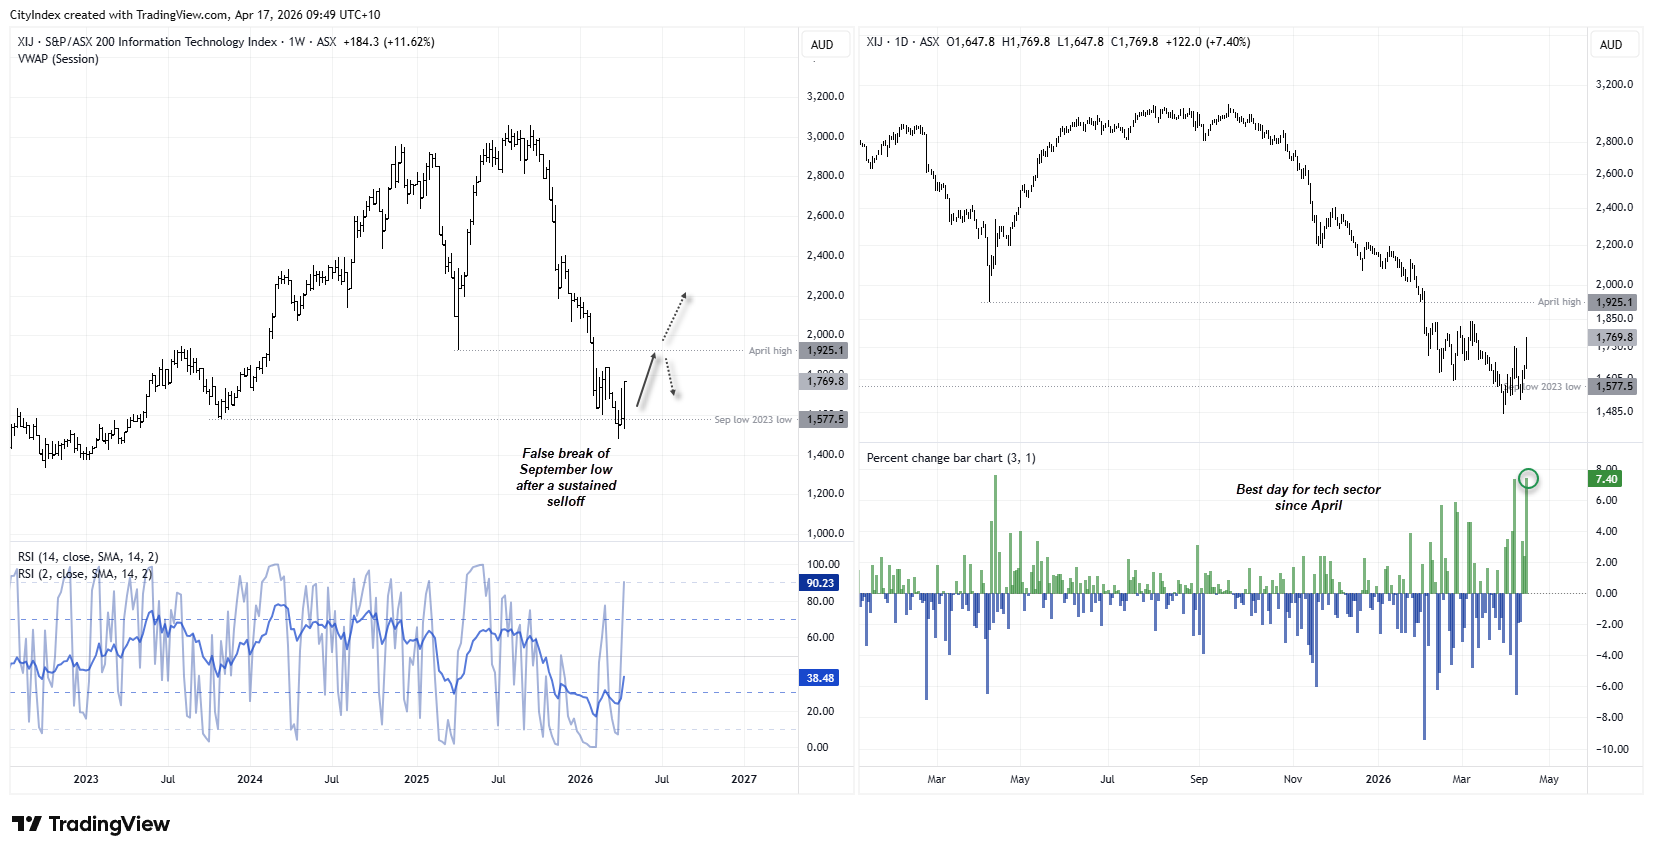
- The Information technology Sector (XIJ) was the clear leader of the five ASX sectors that advanced on Thursday, providing further evidence of an important bottom for the sector
- 6 of the 11 ASX sectors declined, led by Financials (XFJ) and Energy (XEJ)
- Implied volatility has continued to trend lower amid a risk-on tone for global stock markets
- Implied volatility for today is 0.7% according to the 30-day implied volatility index for the S&P ASX 200 VIX (XVI)
- The ASX 20 cash market formed a bearish outside day, following Wednesday’s small shooting star reversal – warning of the potential for a consolidation or minor pullback
Source: ASX, LSEG

ASX Technology (XIJ) Rebound Gains Traction Above Key Support
ASX Information Technology (XIJ) shows early signs of stabilisation after a sharp selloff, with a false break below key support hinting at buyer interest. While the ASX tech sector is attempting a rebound, the broader trend remains bearish, and further upside confirmation is needed above the April highs to signal a sustained recovery in Australian technology stocks.
Source: ASX, LSEG
ASX 200 Technical Analysis
Bearish Signals Emerge Near Highs Despite Resilient Futures
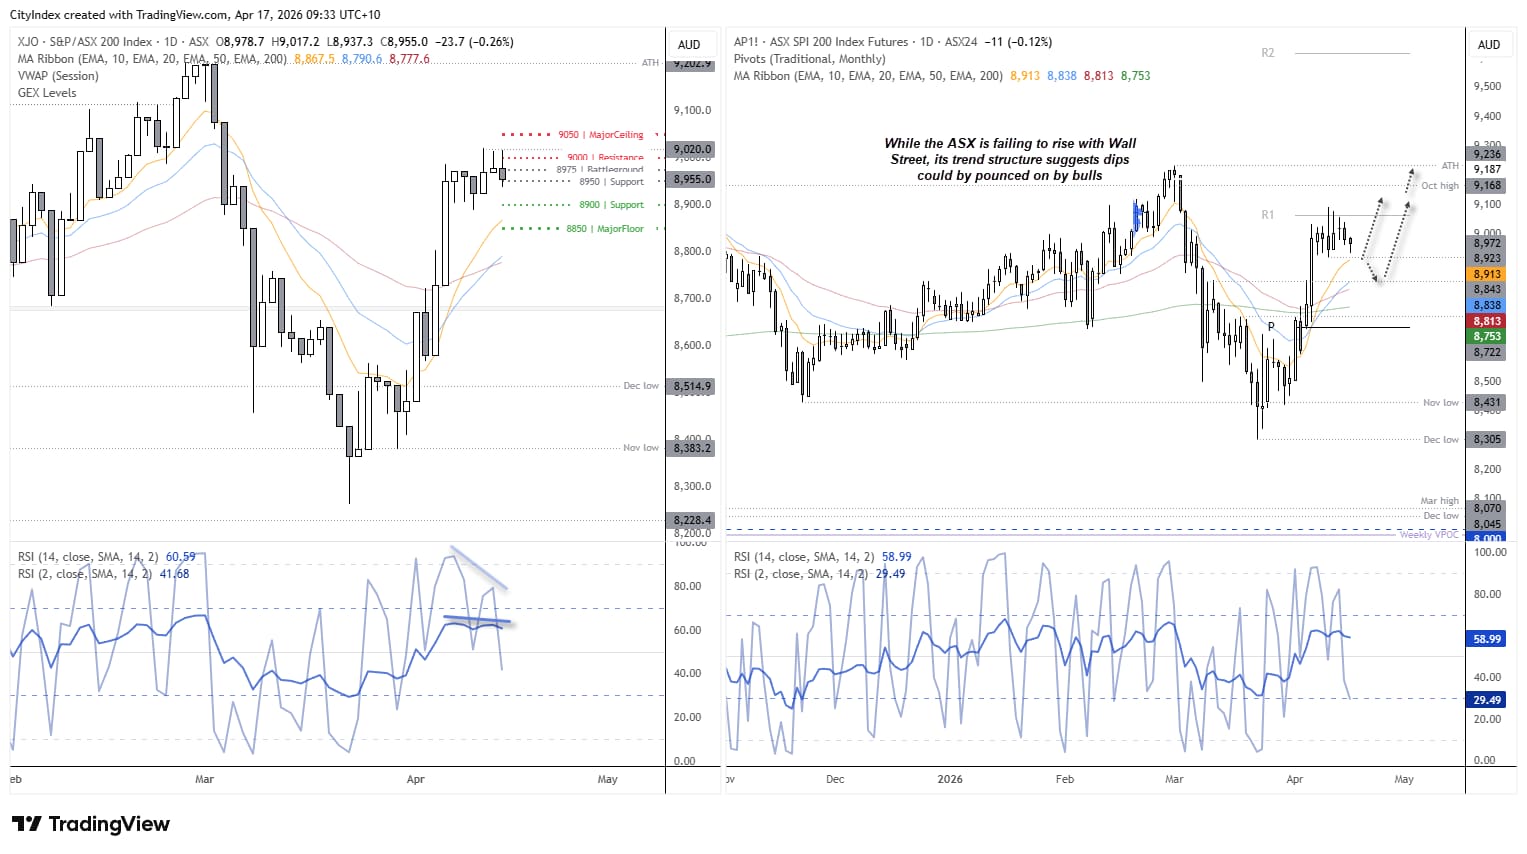
The daily ASX cash market chart (left) shows a bearish outside day formed near the cycle highs. In fact, there appears to be a triple top around 9,020. With bearish divergence on both RSI (2) and RSI (14), a minor pullback could be due.
Meanwhile, the SPI 200 (ASX 200 futures) chart shows prices holding up overnight, refusing to fall but also failing to keep pace with Wall Street’s rally. If the market cannot rise on positive cues, it strengthens the case for at least a near-term pullback.
Even so, bulls may look to buy dips towards the 10 or 20-day EMAs, with a view to a late rally that closes the gap with Wall Street. That could bring the all-time high back into focus over the coming week or two.
Source: ASX, ASX24, TradingView
Options Positioning Points to Tight Range With 9000 as Key Pivot
Options positioning shows the ASX 200 is trading within a tighter, more actionable range. The 8975–8950 area is a key battleground, where price may chop and rotate. Above, 9000–9050 is the resistance zone, where rallies are likely to slow. On the downside, 8900–8850 provides support, where buyers may step in if price pulls back.
In a nutshell: I expect range-bound trading, with chop around 8950–8975, resistance overhead near 9000, and support building below 8900.
View the full economic calendar
-- Written by Matt Simpson
Follow Matt on Twitter @cLeverEdge
How to trade with City Index
You can trade with City Index by following these four easy steps:
- Open an account, or log in if you’re already a customer
• Open an account in the UK
• Open an account in Australia
• Open an account in Singapore
- Search for the market you want to trade in our award-winning platform
- Choose your position and size, and your stop and limit levels
- Place the trade





