
The ASX 200 fell for a second consecutive session on Friday as a technology-led risk-off move spread across global markets. Materials and energy stocks led declines, while healthcare outperformed in a defensive rotation. With volatility elevated, sector correlations strengthening and key support levels coming into focus, traders are assessing whether the recent pullback marks a deeper correction or a pause within the broader recovery from March lows.
View related analysis:
- Australian Dollar Outlook: AUD/USD Bears Tighten Grip with 60s in Sight
- Nasdaq 100 Futures Slip as KOSPI Leads Tech Selloff Across Asia
- Gold Outlook: Peace Hopes Support Gold, Options Market Signals Caution
- ASX 200 Outlook: SPI Futures Rise, But Resistance Looms Over Rally
Risk-Off Mood Weighs on ASX 200 as Tech Weakness Spreads
ASX 200 Market Snapshot
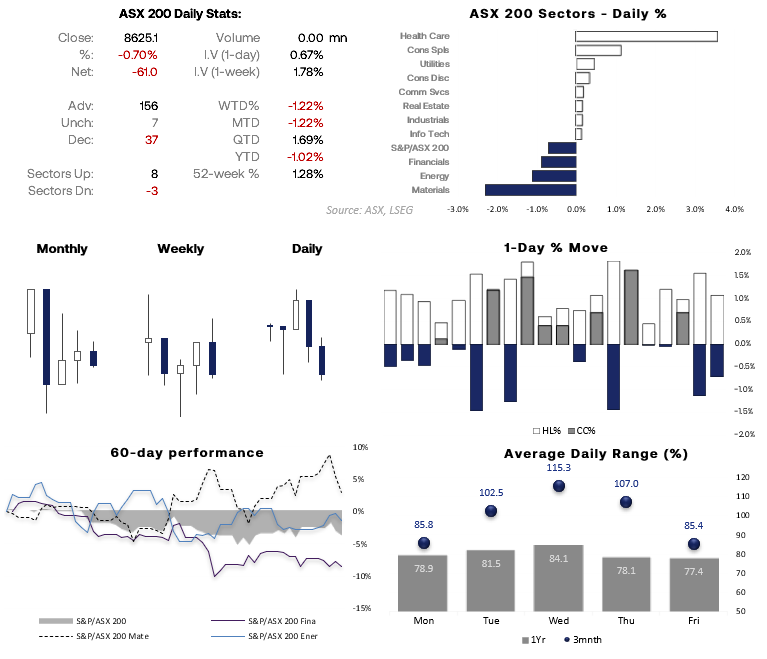
- The ASX 200 closed lower for a second consecutive session on Friday, caught up in the risk-off sentiment emanating from the technology sector.
- Eight of the 11 sectors closed lower, led by Materials (-2.3%) and Energy (-1.1%), while Healthcare (+3.5%) led the three sectors that finished higher.
- SPI 200 futures were little changed overnight.
- Average daily ranges have tended to increase between Monday and Wednesday over the past three months, peaking at 115.3 points and averaging 102.5 points on Tuesdays.
- Volatility has then tailed off into Thursday and Friday, easing to an average daily range of 85.4 points.
- This suggests volatility has been elevated over the past quarter compared with the past year, with 1-year average daily ranges peaking at 84.1 points on Wednesdays and averaging 81.5 points on Tuesdays.
Source: ASX, LSEG
Risk-Off Sentiment Reshapes ASX 200 Sector Relationships
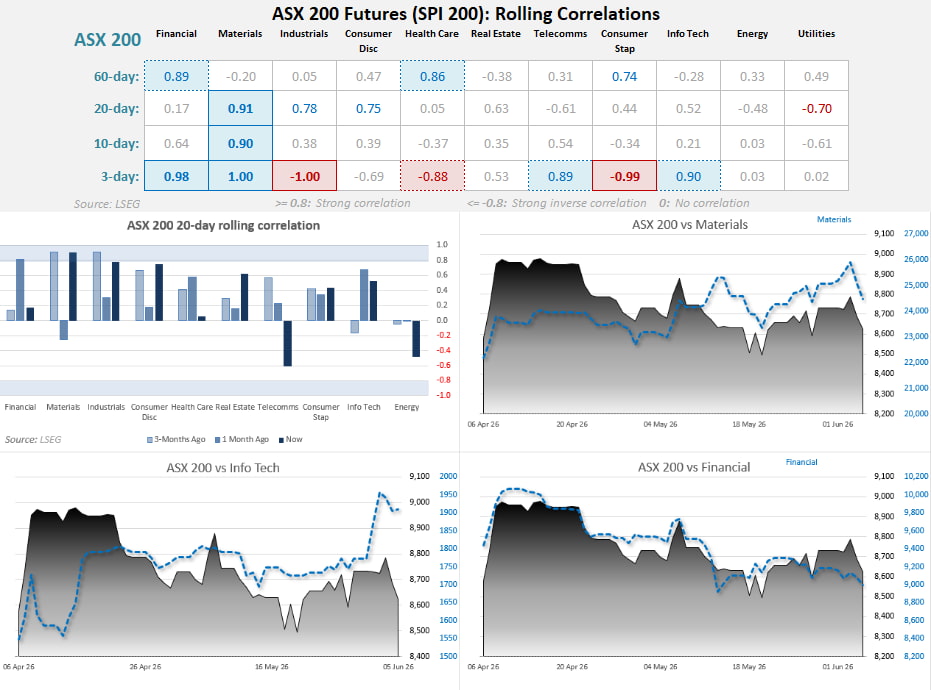
- The materials sector (XMJ) retains one of the strongest correlations with the ASX 200, with readings of 0.90 across the 10- and 20-day lookbacks, rising to a perfect 1.00 over the past three days.
- The risk-off tone driven by renewed Fed hike expectations has seen correlations strengthen across asset classes, with markets increasingly trading either alongside or against broader risk sentiment and the US dollar.
- This has lifted the 3-day correlation between the ASX 200 and the Information Technology sector (XIJ) to 0.90, while Telecommunications (XTJ) has risen to 0.89.
- Meanwhile, Industrials (XNJ) and Consumer Staples (XSJ) acted as defensive havens during the risk-off move late last week.
Source: ASX, LSEG
ASX 200 Technical Analysis
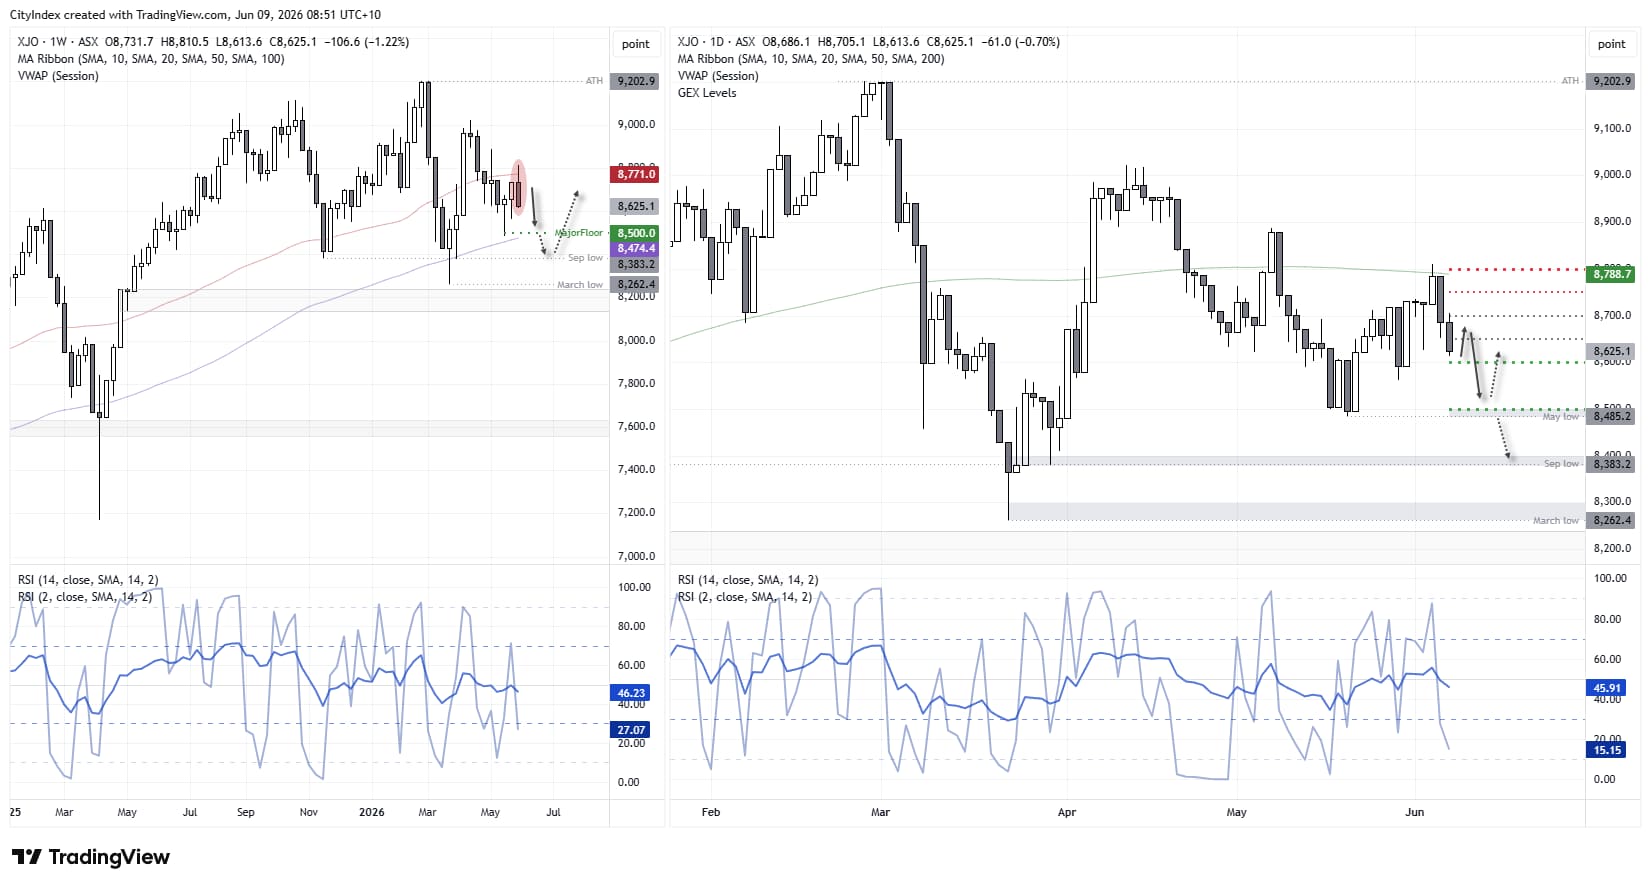
The rally from the May low met resistance at the 200-day SMA before momentum turned lower, shedding half of its gains in just two days. This left a bearish engulfing candle on the weekly chart after the advance stalled around the 50-week SMA. A move back towards 8500, near the May low, remains possible, although I'm reluctant to turn outright bearish given the ASX 200 has already staged a solid recovery from its March low.

ASX 200 Faces Key Test at 8600 Support
A major options support level sits nearby at 8600, and with SPI 200 futures little changed overnight, the index may be able to find some stability today. For now, my bias is that traders will look to fade rallies within Friday's range and target the swing lows around 8500. That area also aligns with a large concentration of put options, making it an important support zone if downside momentum extends.
The risk to the bearish view is that traders fail to break below 8600, which remains a key options support level. Until we see acceptance beneath that level, bears may prefer to wait for a corrective bounce towards 8700 before re-engaging, particularly if prices continue to gravitate towards the large options positioning clustered around that strike.
Source: ASX, TradingView
View the full economic calendar
-- Written by Matt Simpson
Follow Matt on Twitter @cLeverEdge
How to trade with City Index
You can trade with City Index by following these four easy steps:
- Open an account, or log in if you’re already a customer
• Open an account in the UK
• Open an account in Australia
• Open an account in Singapore
- Search for the market you want to trade in our award-winning platform
- Choose your position and size, and your stop and limit levels
- Place the trade