
The Australian dollar has slipped below the key 70c level as persistent US inflation supports the US dollar and dampens hopes for Fed rate cuts. With implied volatility turning higher, risk reversals signalling greater demand for downside protection, and yield spreads favouring the greenback, AUD/USD bears are increasingly setting their sights on the 69c handle.
View related analysis:
- US Dollar Rally Pauses Ahead of CPI as FX Majors Diverge
- Nasdaq 100 Volatility Erupts as Futures Positioning Warning Plays Out
- ASX 200 Under Pressure as Tech-Led Risk Aversion Spreads
- Australian Dollar Outlook: AUD/USD Bears Tighten Grip with 60s in Sight
- Short Yen Bets Hit Record High, AUD Nears Net-Short Flip | COT Report
AUD/USD Forecast: Australian Dollar Faces Further Downside Risks Below 70c
Sticky US Inflation Keeps Fed Cut Expectations in Check
US core CPI was slightly softer than expected at 0.2% in May, while all other headline metrics came in as forecast. Yet there remains little for those hoping for Fed rate cuts to celebrate. US inflation remains elevated, and with peace talks between the US and Israel once again breaking down and fears of renewed attacks resurfacing, crude oil prices and inflation expectations have moved higher. US producer prices released later today seem unlikely to derail the inflationary narrative.
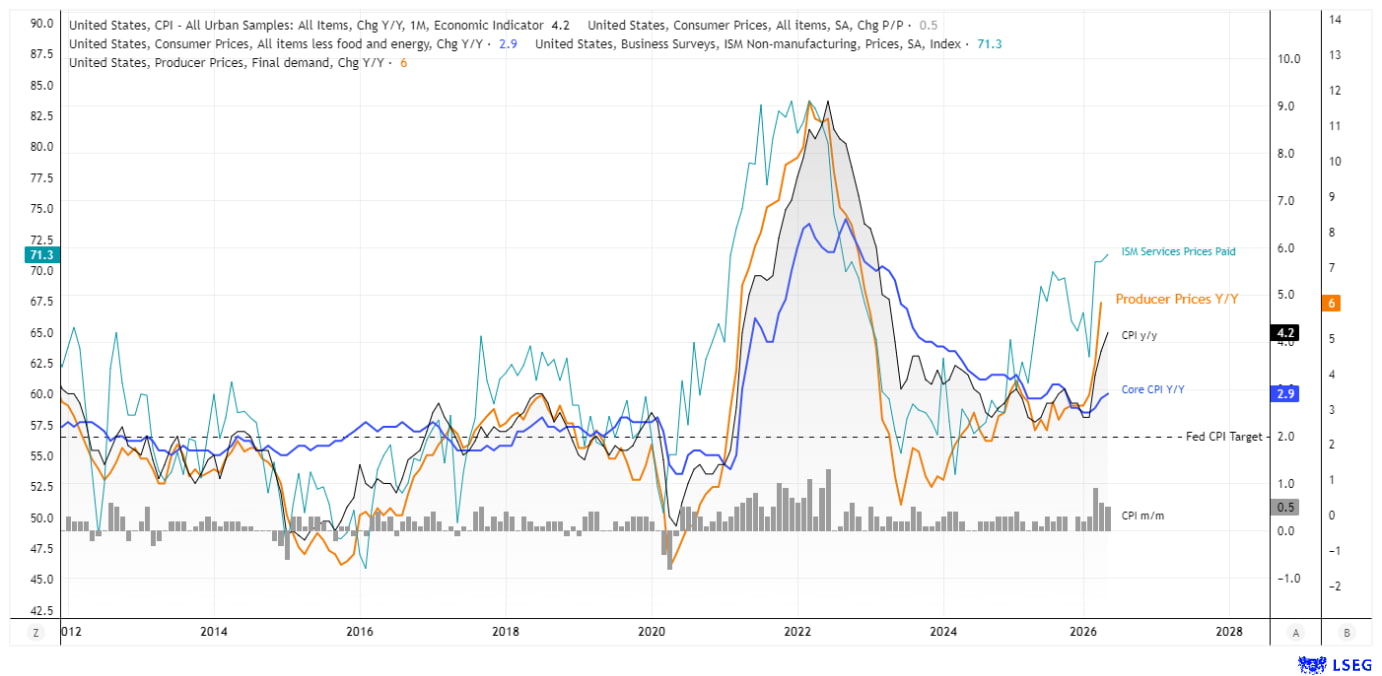
Source: BLS, ISM, LSEG
Elevated Inflation Pressures Continue to Support the US Dollar
This continues to underpin the US dollar, to the detriment of the Australian dollar, which is being weighed down by risk-off flows, softer commodity prices, and fading expectations of further RBA rate hikes.
Not only did AUD/USD reach my unpopular downside target of 70c, but it also briefly traded below the 70c handle ahead of the US close. Whether it extends its losses from here will likely depend on headline developments surrounding the US and Iran. Regardless of whether we see an initial bounce or a deeper breakdown, I do not believe the Australian dollar's downside move is over yet.

AUD/USD Technical Analysis: Australian Dollar vs US Dollar
Volatility Awakens as Bearish Momentum Accelerates for AUD
The weekly chart on the left shows AUD/USD formed a bearish engulfing candle last week, which is also a lower high and most bearish week in 10, and most volatile week in 7. Implied volatility levels are also curling higher after a 13-week decline. Given volatility is cyclical and down from its peak, an upswing in volatility is not to be unexpected.
- 1-week implied volatility level of 7.915 implies a 76.8-pip (1.1%) move in either direction, suggesting a 68% chance it will close within 0.6922 – 0.7076.
- 1-month implied volatility of 8.065 suggests a 161.8 pip (2.31) move in either direction, with a range of 0.6387 – 0.7161
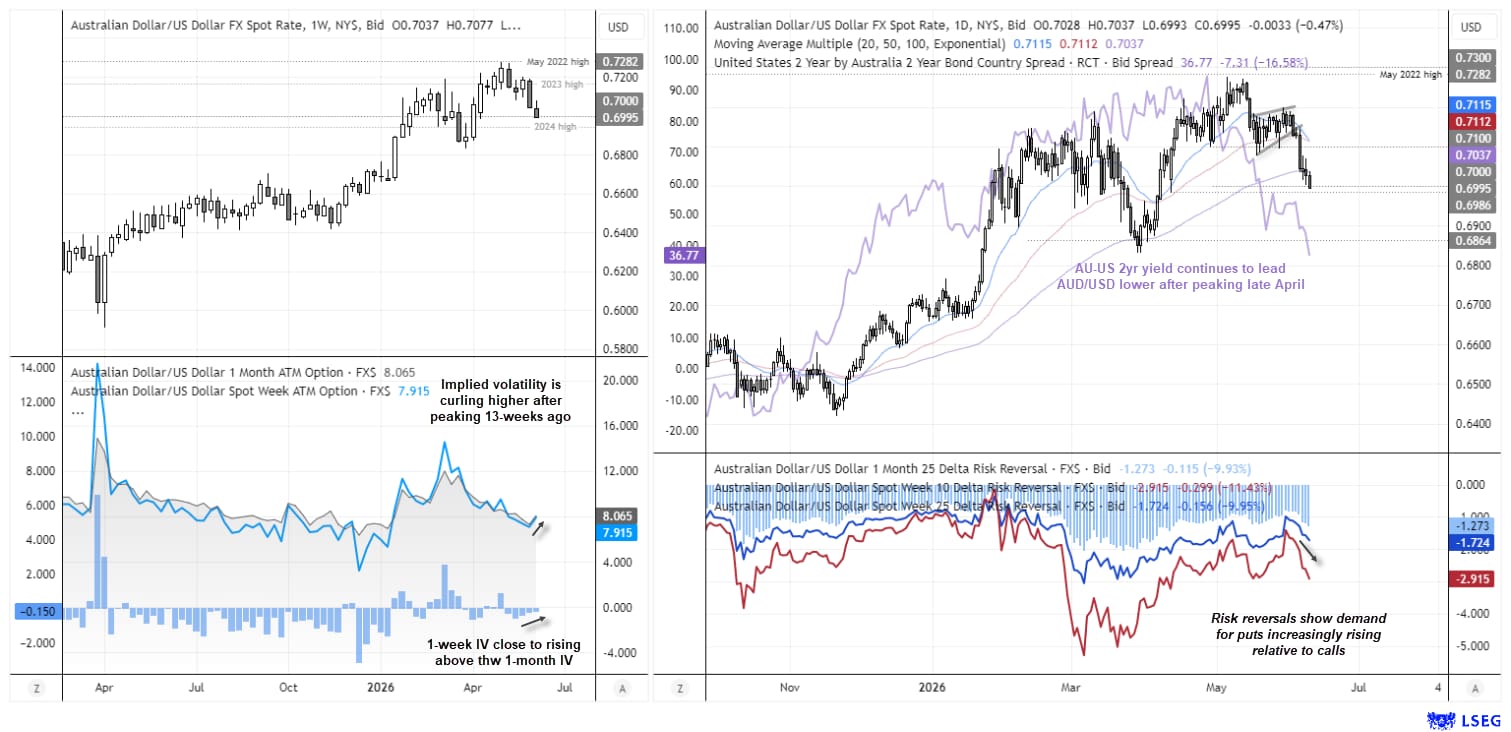
Source: LSEG
Yield Differentials and Risk Reversals Point to Further AUD/USD Weakness
The daily chart shows that the AU–US 2-year yield spread (purple) continues to point lower, having already signalled a bearish reversal in AUD/USD back in late April. Given the divergent monetary policy outlooks for the RBA and Fed, the yield differential could widen further and weigh on the Australian dollar accordingly.
Also note that risk reversals are confirming the move lower in AUD/USD, with demand for puts increasingly outweighing demand for calls. The 11-week 10-delta risk reversal (red), which captures demand for downside tail-risk protection, is leading the move lower.
This content was created by an affiliate of FOREX.com and represents the views and opinions of the author/speakers, not the views and opinions of FOREX.com, StoneX Group Inc., or its subsidiaries. The content has not been independently reviewed by FOREX.com.
AUD/USD Bears Eye 69c Despite Major Support Cluster
As compelling as a breakdown appears for AUD/USD heading into today's session, bears may want to err on the side of caution given the cluster of support levels nearby. The 70c handle is a significant level in its own right, but it is also reinforced by the weekly S1 and monthly S2 pivots, alongside a 100% downside projection.
Despite this support cluster, the weekly and monthly VWAPs continue to point lower, confirming the bearish trend in price action. The bias therefore remains for bears to fade rallies and target the 69c handle, near the high-volume node (HVN).
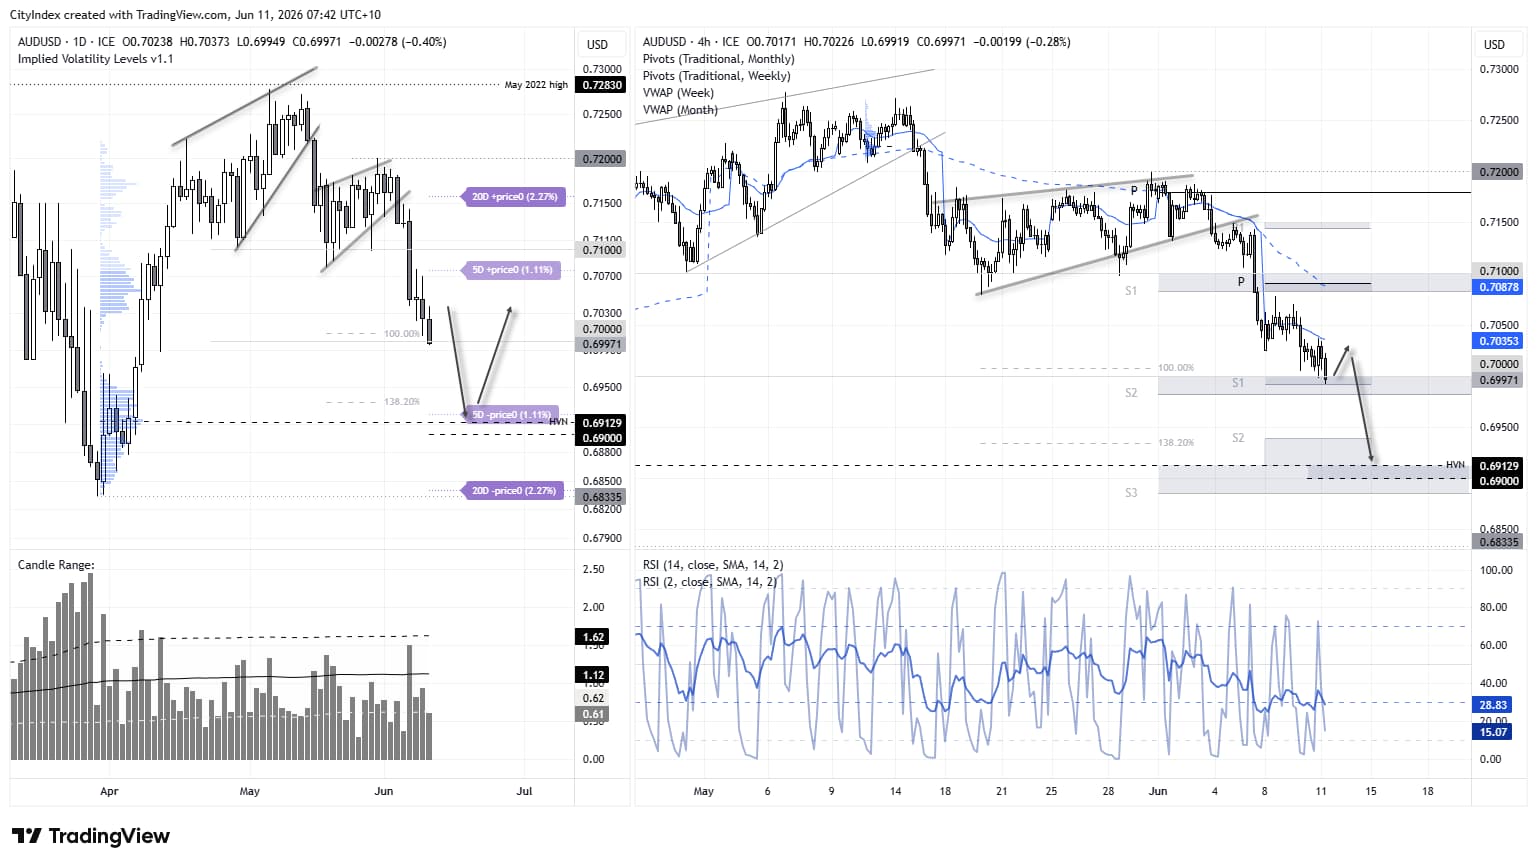
Source: ICE, TradingView
View the full economic calendar
-- Written by Matt Simpson
Follow Matt on Twitter @cLeverEdge
How to trade with City Index
You can trade with City Index by following these four easy steps:
- Open an account, or log in if you’re already a customer
• Open an account in the UK
• Open an account in Australia
• Open an account in Singapore
- Search for the market you want to trade in our award-winning platform
- Choose your position and size, and your stop and limit levels
- Place the trade