
Gold is generally bearish in June according to its seasonal average this century, and this year has not disappointed. The metal has already fallen more than 10%, despite the month not yet being halfway complete.
It is also on track for a fourth consecutive monthly decline, which would mark its longest bearish streak since October 2022, unless it can defy gravity and break above 4,578 by 30 June.
While another bearish month appears likely, the nearby 4,000 level stands out as an obvious area for bears to lock in profits or for sidelined bulls to take a speculative punt. Recent data from the Commitment of Traders (COT) report also shows bearish bets are plummeting, while overall volumes continue to contract. That is not the type of participation I would typically expect to see during a healthy downtrend.
View related analysis:
- Australian Dollar Outlook: AUD/USD Cracks 70c, Options Signal More Pain
- Gold Outlook: Peace Hopes Support Gold, Options Market Signals Caution
- Nasdaq 100 Futures Slip as KOSPI Leads Tech Selloff Across Asia
- How to Read the COT Report to Track Forex Market Sentiment
Gold Futures Positioning Signals Bearish Exhaustion
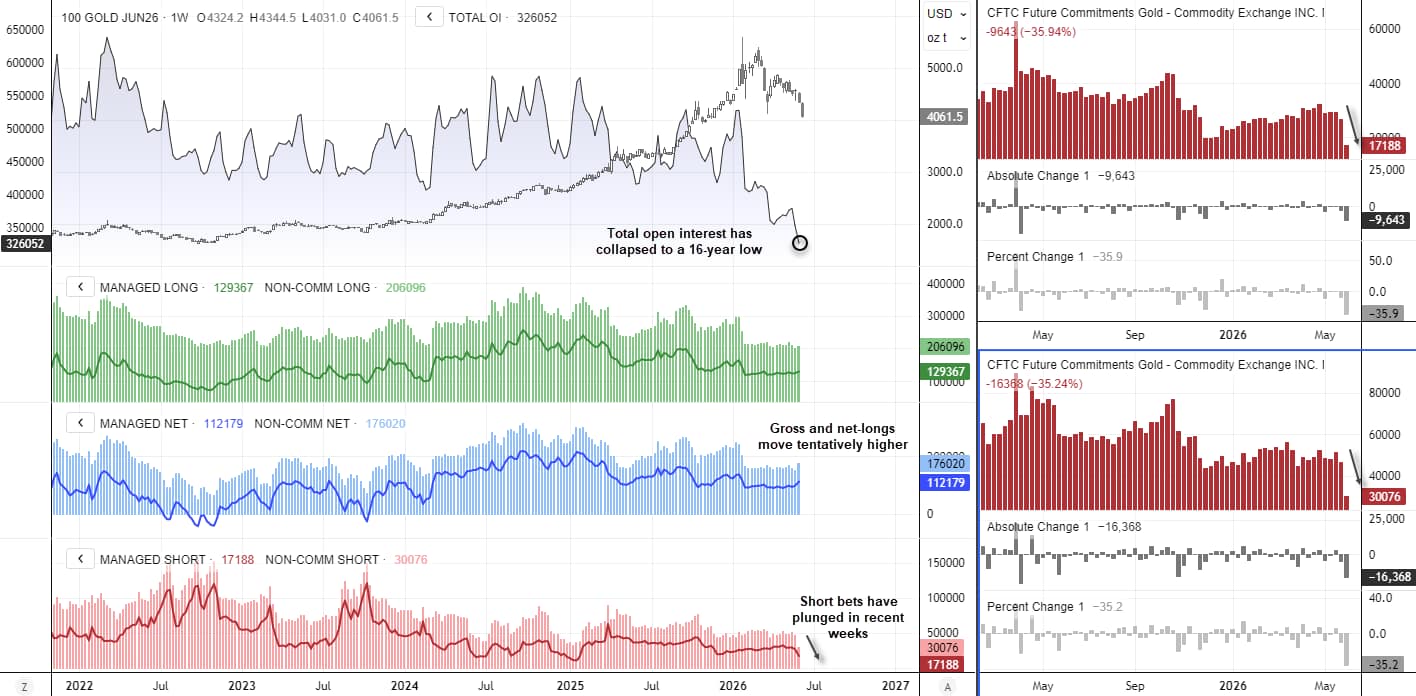
Short bets against gold have effectively collapsed, with large speculators and managed funds shedding 26k short contracts last week alone — their fastest weekly reduction in 14 months. This has seen gross shorts plummet to a five-year low of 30k contracts among large speculators, and a 17-month low of 17.2k contracts among managed funds.
We're also seeing tentative signs of life among gold bulls. Net-long exposure rose to an 18-week high among both large speculators and managed funds, driven by a gradual increase in long positions and a sharp reduction in shorts.
It is also worth noting that total open interest — which measures trading activity across all futures participants — has fallen to a 19-month low. While this underscores a broader trend of de-risking among gold futures traders, it is also not what I'd expect to see during a bearish trend backed by strong conviction. And with gold heading towards 4,000 support, perhaps it could be enough to tempt sidelined bulls back into the market.
Source: COMEX, CFTC (COT)

Gold's June Selloff Far Exceeds Seasonal Norms
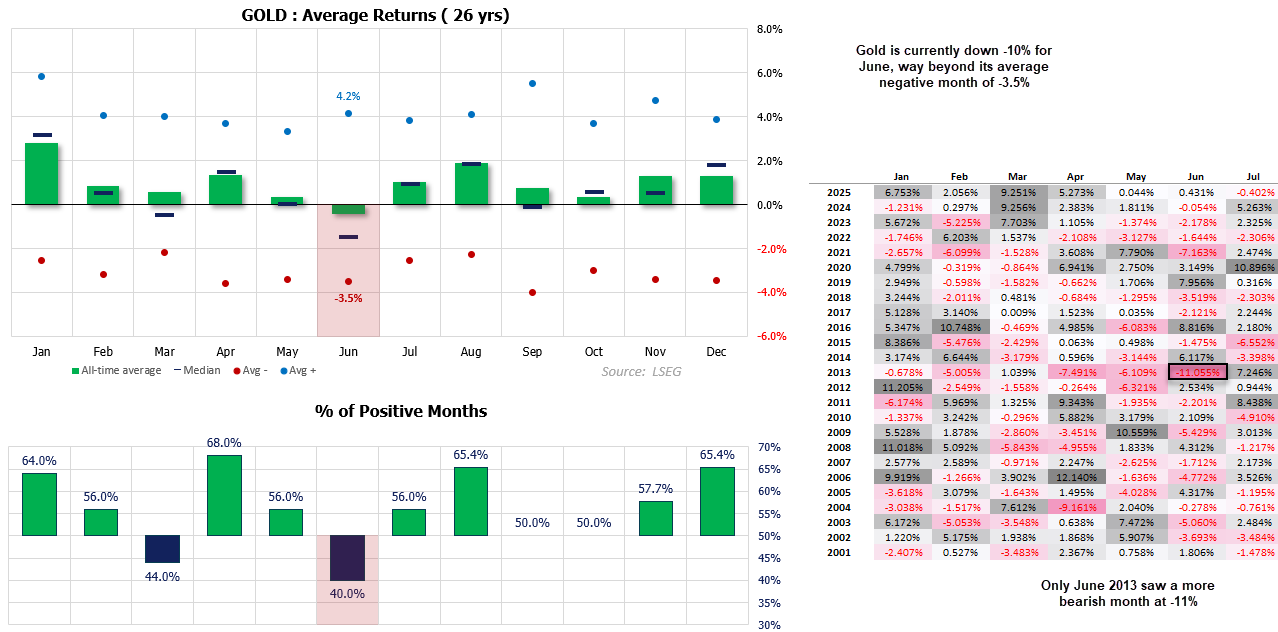
As for seasonality, gold has already far exceeded its typical bearish performance for June. Using data since 2000, June is the only month with a negative average return for gold, at -0.4%. Its median return is even weaker at -1.5%.
With a win rate of just 40%, gold has closed lower 60% of the time in June, making it the worst-performing month of the year and the least likely to deliver a bullish outcome.
However, gold has already fallen more than 10% this June, while its average negative return for the month is just -3.5%. There has been only one instance in this dataset that exceeds the current selloff: June 2013, when gold fell 11%.
For comparison, gold could rally around 7% from current levels and still close near 4,415, matching its average June decline of -3.5%. With support nearby, short positions being covered and long exposure gradually increasing, I am warming to the idea that the path of least resistance for gold may be higher.
Source: COMEX, LSEG
Gold Risk Reversals Hint at Rebound Potential
Risk reversals have been declining alongside gold prices, showing that demand for puts has been rising relative to demand for calls. While this can be interpreted as a bearish signal, context matters.
When we consider the speed at which the 1-week delta-10 risk reversal (tail risk) has fallen, alongside the fact it is approaching levels from which a rebound emerged in March, it suggests bearish sentiment may be becoming stretched. Combined with signs of short covering in futures markets, the risk-reward profile appears increasingly supportive of a bounce in gold.

Source: CME, LSEG
View the full economic calendar
-- Written by Matt Simpson
Follow Matt on Twitter @cLeverEdge
How to trade with City Index
You can trade with City Index by following these four easy steps:
- Open an account, or log in if you’re already a customer
• Open an account in the UK
• Open an account in Australia
• Open an account in Singapore
- Search for the market you want to trade in our award-winning platform
- Choose your position and size, and your stop and limit levels
- Place the trade