
Middle East peace hopes sparked a broad risk-on rally across financial markets, lifting equities and metals while weighing on the US dollar. The shift in sentiment pushed USD/JPY below the key 160 level and helped AUD/JPY rebound from support, although both moves remain highly dependent on whether a formal peace agreement ultimately materialises.
View related analysis:
- Gold Plunges Beyond Seasonal Expectations, Yet Bearish Bets Are Falling
- Australian Dollar Outlook: AUD/USD Cracks 70c, Options Signal More Pain
- US Dollar Rally Pauses Ahead of CPI as FX Majors Diverge
- Nasdaq 100 Futures Slip as KOSPI Leads Tech Selloff Across Asia
- Nasdaq 100 Volatility Erupts as Futures Positioning Warning Plays Out
USD/JPY Falls Below 160 as Peace Hopes Boost AUD/JPY
Hopes of peace in the Middle East triggered a strong bout of risk-on sentiment, sending Wall Street higher alongside metals. AUD/USD and NZD/USD topped the FX leaderboard, while the US dollar came under broad pressure. Brent crude oil fell around 3% to 90.38, while WTI crude declined 4% to 86.40.
The key word here is hopes. Once again, President Donald Trump was driving claims that a peace deal was close, this time going a step further by saying that the time and location of the signing would be announced shortly. Yet conflicting headlines have already begun to emerge, with Iran and Israel denying the existence of any such agreement. That means risk sentiment could quickly reverse if this proves to be another deal that disappears as quickly as it supposedly arrived.
That said, with markets already looking stretched, I doubt we would see a complete reversal. In fact, I'd go as far as to say that any pullback could still attract dip buyers, given these moves may have further to run into next week. Of course, confirmation of a formal deal could provide the catalyst for risk assets to extend their gains even further.
Source: ICE, TradingView
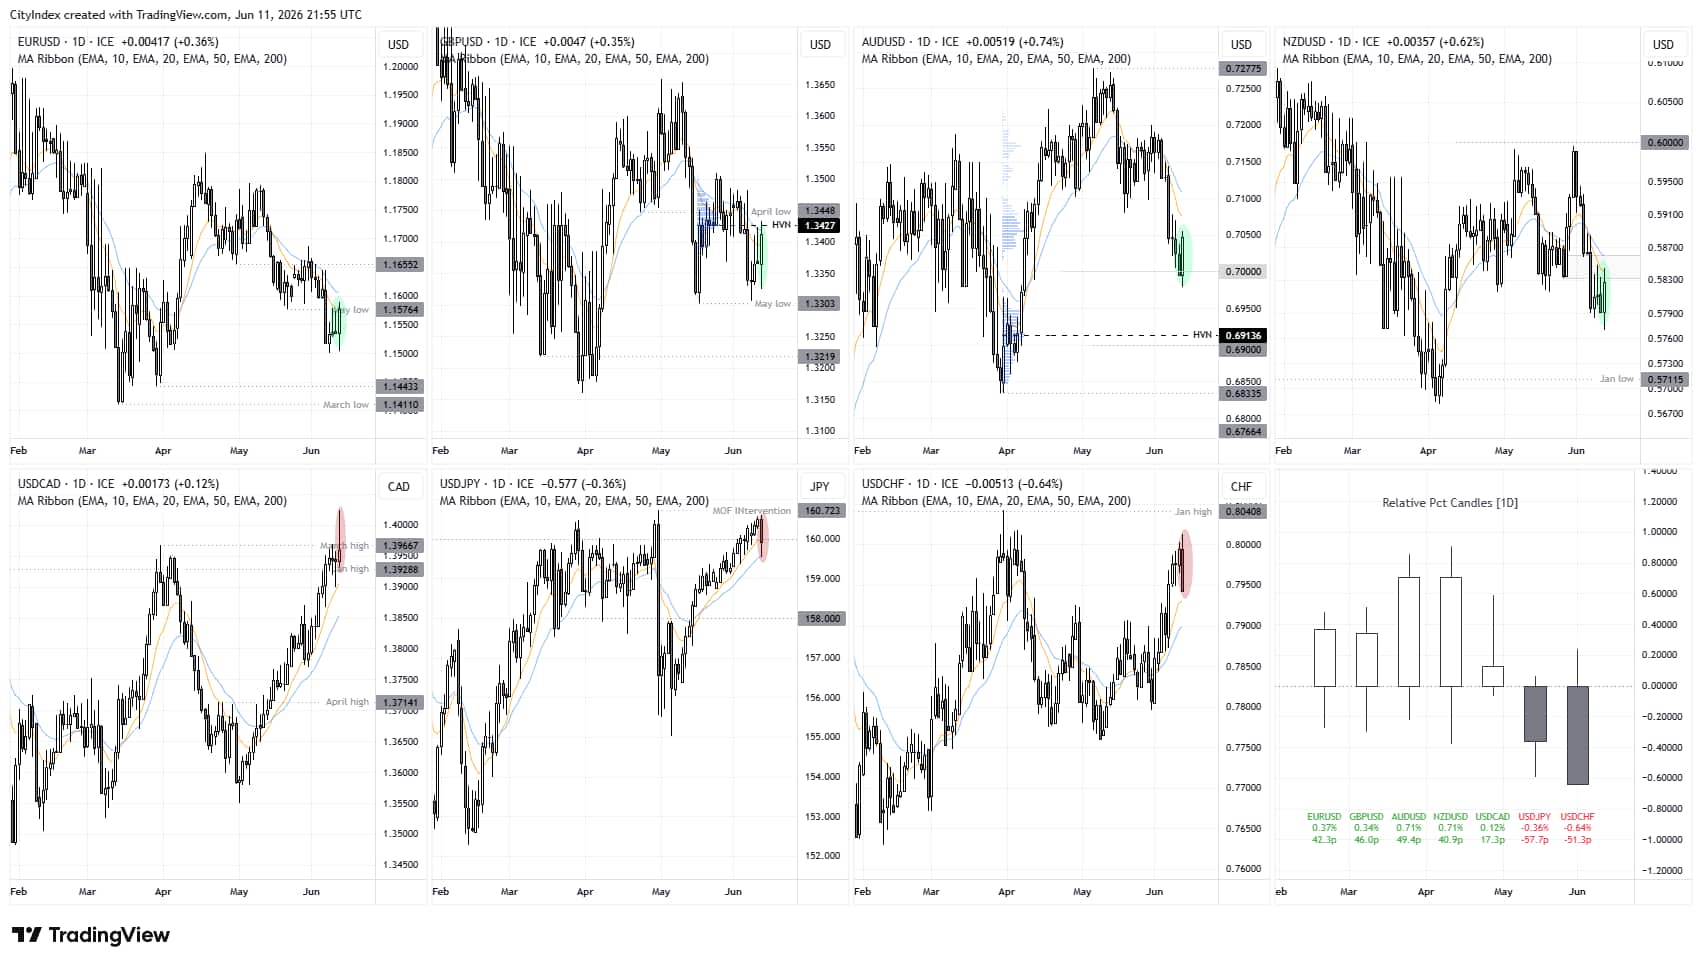
FX Majors, Gold and Wall Street Performance Snapshot
- The US dollar was the weakest FX major with the USD index forming a bearish outside day beneath the May high during its worst day in six weeks
- EUR/USD formed a bullish engulfing day with a marginal higher low above the 1.15 handle, with bulls now eyeing a break of 1.16
- AUD/USD formed a bullish engulfing day and was the strongest FX major, rising 0.8% in line with yesterday’s bullish bias to mark its best day in six weeks
- NZD/USD was a close second place and also formed a bullish engulfing day
- USD/CHF formed a sharp reversal lower following a false break of 0.80 and formed a bearish engulfing day, with the Swiss franc rising alongside the Japanese yen as a falling US dollar drove sentiment
- USD/CAD formed an elongated shooting star / bearish pinbar and false break of 1.40 to hint of an interim top amid an otherwise strong bullish trend
- Gold bulls enjoyed their best day in four months with pricing clearly trying to form a base above 4,000, rising in line with yesterday’s bullish bias and warnings of a potential bounce
- Wall Street indices were broadly higher with the Nasdaq 100 leading the charge and forming a prominent bullish outside day
This content was created by an affiliate of FOREX.com and represents the views and opinions of the author/speakers, not the views and opinions of FOREX.com, StoneX Group Inc., or its subsidiaries. The content has not been independently reviewed by FOREX.com.
Could Peace Deal Hopes Open the Door for Yen Intervention?
With the US dollar on the back foot, it raises the question of whether this could provide an opportunity for Japan's Ministry of Finance (MOF) to intervene in support of the yen. We know that USD/JPY has struggled to remain above 160 for long in recent years due to intervention, although the fundamental backdrop has not been particularly supportive of that playbook. However, if a peace deal does come to fruition, a key driver of higher inflation expectations would effectively evaporate. The US dollar would likely come under pressure, potentially allowing traders to do some of the MOF's work for them, or giving authorities the chance to intervene at a more opportune time.
Ultimately, USD/JPY has signalled a potential swing high on the daily chart, opening the door for a pullback. The depth and pace of any decline will likely depend on whether a deal is signed. A failure for an agreement to materialise could instead see USD/JPY resume its advance and push to fresh highs.
USD/JPY Technical Analysis: US Dollar vs Japanese Yen
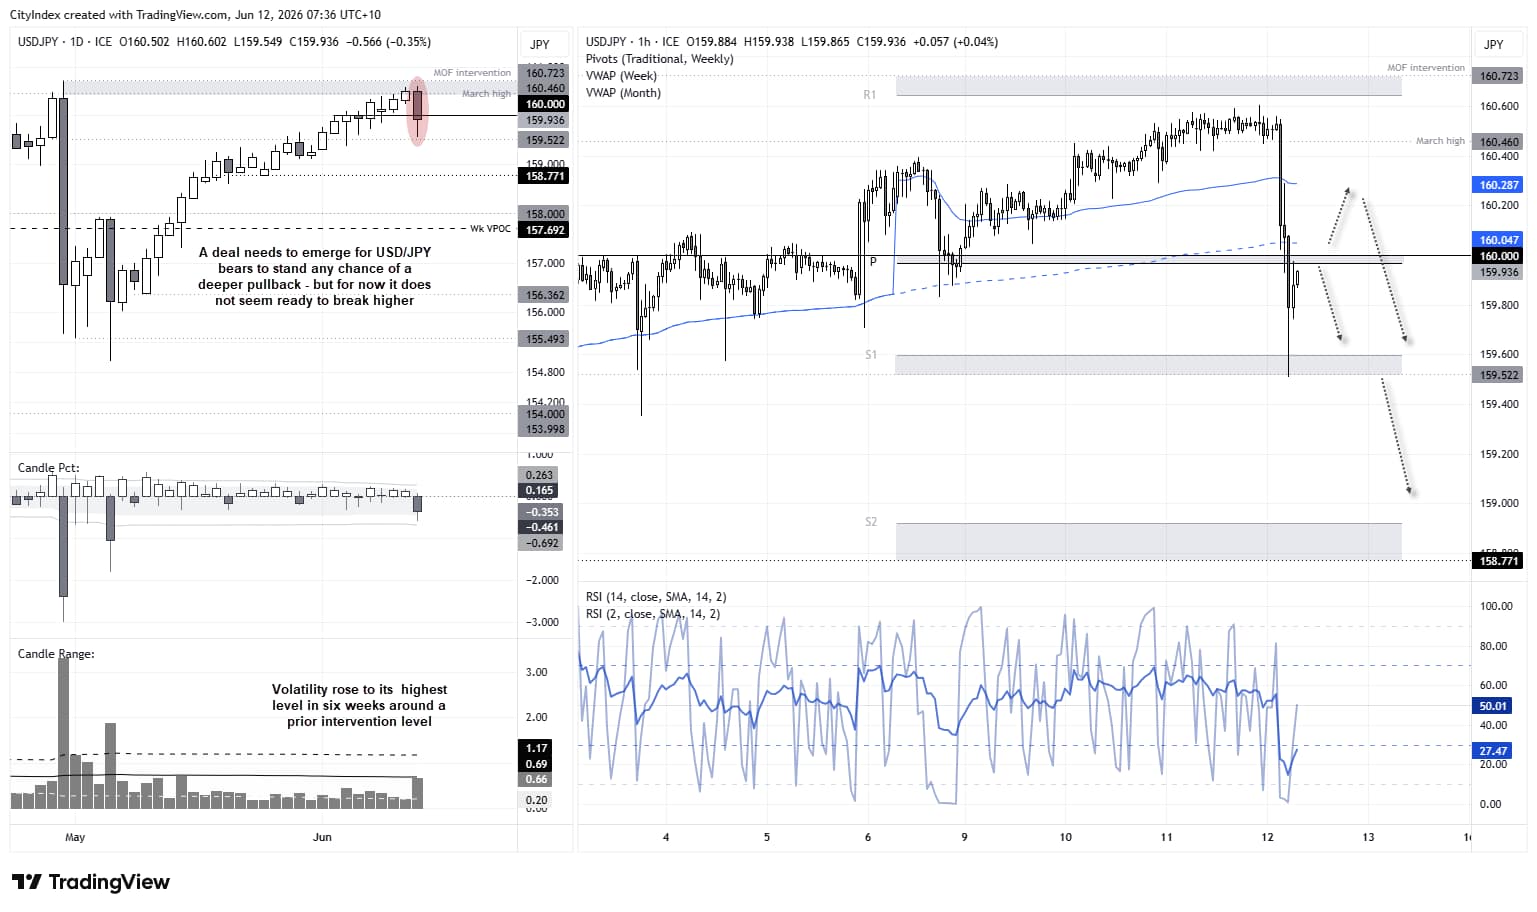
USD/JPY Bears Eye Intervention Zone as Volatility Returns
The daily chart shows that volatility picked up notably on Thursday, with the high to low range on USD/JYP being its most volatile and bearish in four weeks. The fact a volatile bearish outside day formed just pips below the April 30 intervention level makes the chart the more compelling for bears, but of course they also need a deal to materialise before assuming a sharp selloff from here. But it is worth remembering that recent history shows that MOF interventions tend to coincide with tops on the USD/JPY lasting months.

160.00 Re-Emerges as a Key Battleground for USD/JPY
The 1-hour chart shows the surge of bearish momentum found support around the weekly S1 pivot and daily low of the day prior to April 30 intervention. Notice that the retracement higher is stalling around the weekly pivot point and 160 handle, making it a pivotal level in the coming hours. But in all the time hopes of a deal remain alive, I suspect bears will be seeking to fade into minor rallies in an attempt to take it lower.
Whether we see a real move to the downside of course hinges upon an actual deal materialising.
Source: ICE, TradingView
AUD/JPY Technical Analysis: Australian Dollar vs Japanese Yen
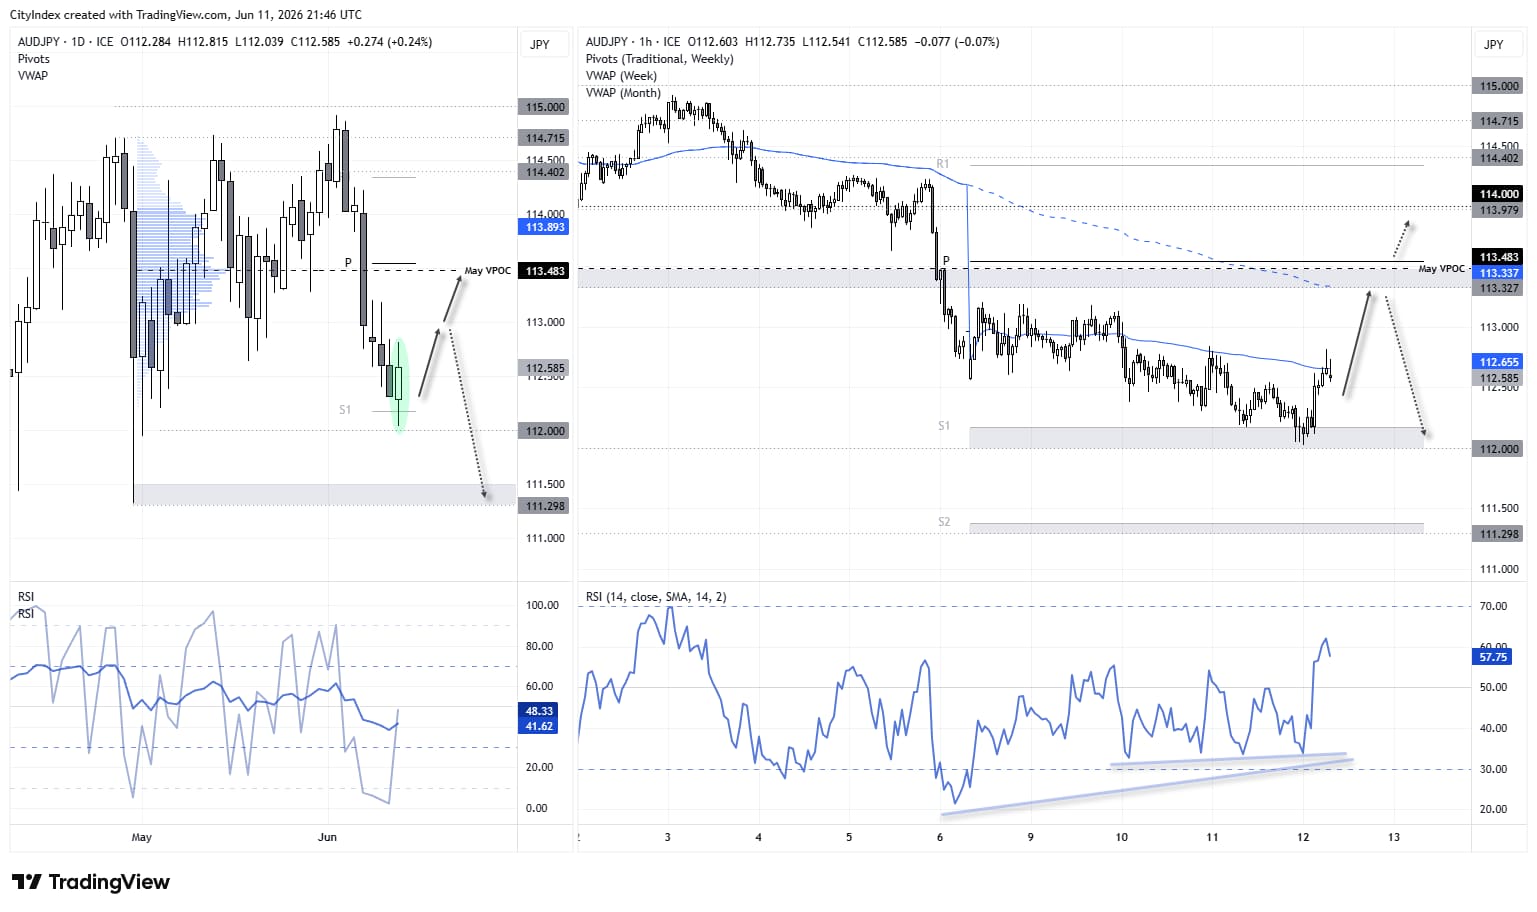
With the Australian dollar closely tied to risk sentiment surrounding this elusive peace deal, the success of any potential bounce is also linked to its outcome. However, we have already seen a decent pullback across Aussie pairs, while AUD/USD has found support around 0.70. As such, I suspect AUD/JPY may have already formed a near-term swing low regardless.
A bullish engulfing candle just above 112.00 hints at a swing low, while the daily RSI (2) reached oversold territory the day before. The 1-hour chart shows a strong surge in bullish momentum from the weekly S1 pivot point.
Source: ICE, LSEG
View the full economic calendar
-- Written by Matt Simpson
Follow Matt on Twitter @cLeverEdge
How to trade with City Index
You can trade with City Index by following these four easy steps:
- Open an account, or log in if you’re already a customer
• Open an account in the UK
• Open an account in Australia
• Open an account in Singapore
- Search for the market you want to trade in our award-winning platform
- Choose your position and size, and your stop and limit levels
- Place the trade