
AUD/USD is testing 0.72 ahead of the RBA meeting, but momentum is beginning to fade after a strong multi-week rally. While the uptrend remains intact, positioning is stretched and price action shows signs of hesitation near resistance.
A hawkish RBA outcome could help extend gains, although the broader direction still hinges on the US dollar. For now, bulls may prefer to buy dips rather than chase breakouts as the pair consolidates near recent highs.
View related analysis:
- FX Futures Positioning: USD, USD/JPY, GBP/USD, AUD/USD | COT Report
- Japanese Yen Intervention: Volatility Fades, But Turning Points Emerge
- US Dollar Outlook: Bullish May Seasonality Meets Volatility Risk
- Australian Dollar Outlook: AUD/USD Bulls Eye Breakout as CPI and FOMC Loom
Australia’s Key Events This Week for AUD/USD Traders
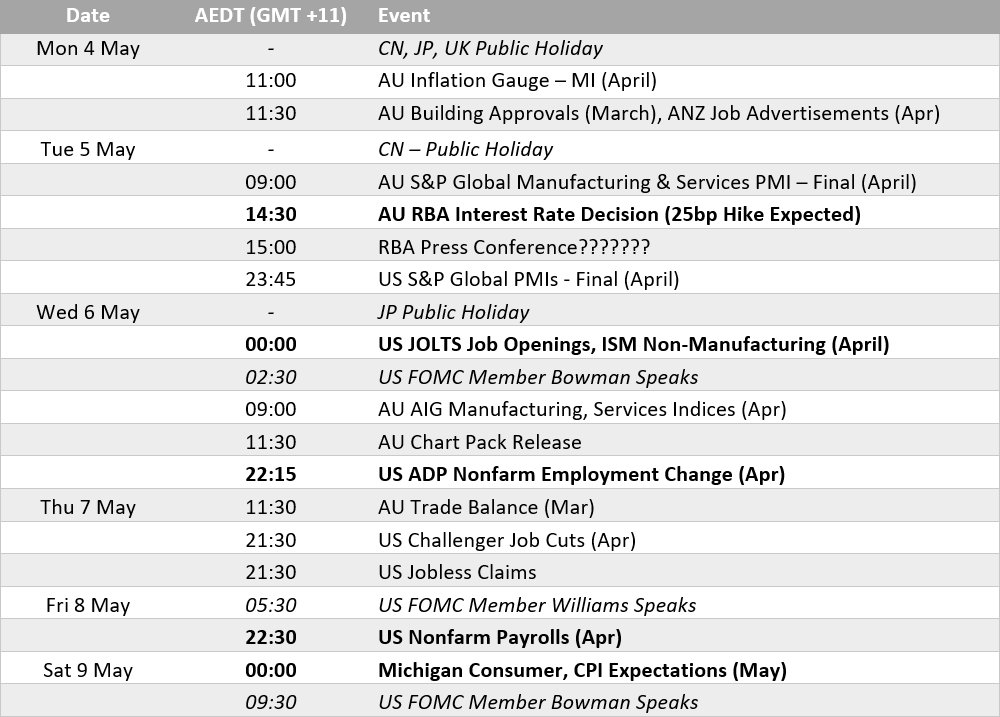
It’s a busy calendar, though one marred by public holidays and lingering uncertainty around the Middle East. That could make for a quiet start to the week, with markets in China, Japan and the UK closed. Australia’s building approvals and job ads are unlikely to shift the dial for the RBA, and Tuesday’s final PMI read is also unlikely to be market-moving.
Sticky Inflation and Energy Risks Support RBA’s Hawkish Bias
The Reserve Bank of Australia is highly likely to deliver a 25bp hike, taking the cash rate to 4.35%.
Trimmed mean inflation remained above the RBA’s 2–3% target band for a second consecutive quarter in Q1, while headline CPI rose to 4.6%. Housing, transport, and food were the primary drivers—effectively meaning households are paying more to live, commute, and eat.
Looking ahead, inflation risks remain skewed to the upside. The closure of the Strait of Hormuz and crude oil prices holding above $100—more than 60% above pre-war levels—point to ongoing second-round inflation pressures. That reinforces the case for rates staying higher for longer.
RBA officials have also maintained a hawkish tone in recent commentary. While cash rate futures imply a 76% probability of a hike, the true likelihood may be higher given the persistence of inflation and external price pressures.

US Data in Focus, But Fed and Geopolitics May Dominate
For the US, ISM services and the Nonfarm Payrolls (NFP) report are the key highlights. The ISM services report could show a further rise in the prices paid component, which is already elevated for obvious reasons. Meanwhile, headline job growth in the NFP report has been rebounding after a couple of softer prints, with unemployment also edging lower.
However, with the Fed not signalling rate cuts any time soon—and markets waiting for the incoming Chair to take the helm—US data may not carry the same weight it once did, particularly against the backdrop of geopolitical risks linked to Iran.
Australian Dollar Performance
However, performance was mixed and volatility softer than bulls had become accustomed to. With some positioning metrics arguably stretched and the US dollar index holding above a volume support cluster near 97, AUD/USD bulls may want to tread cautiously and look for a hawkish RBA hike this week.
- AUD/USD: Highest weekly close since May 2022, although the bullish outside week suggests a loss of upside momentum
- AUD/CAD: Weekly doji closed just above the April 2021 high, suggesting 0.9783 could be a pivotal level
- AUD/CHF: Rose for a fifth consecutive week, though it closed just shy of the January 2015 weekly low (SNB peg removal)
- AUD/EUR: Closed higher for a fifth week, marking its highest weekly close since November 2024
- AUD/GBP: Small bullish outside week delivered its highest weekly close since December 2023, with resistance looming at the March high (0.5345)
- AUD/JPY: Bearish outside week and long-legged doji warn of potential weakness within the broader uptrend
- AUD/NZD: First weekly close above 1.22 since April 2013
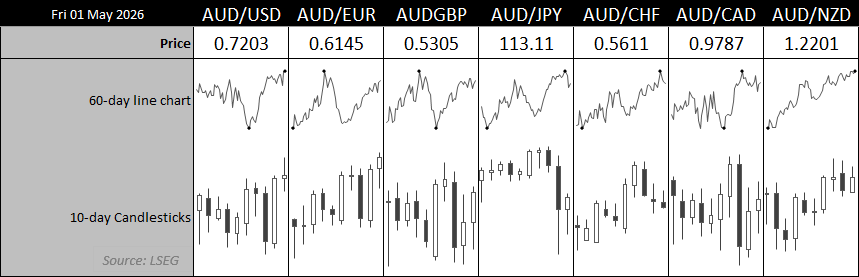
Chart prepared by Matt Simpson - Source: LSEG
AUD/USD Technical Analysis: Australian Dollar vs US Dollar
AUD/USD Correlations
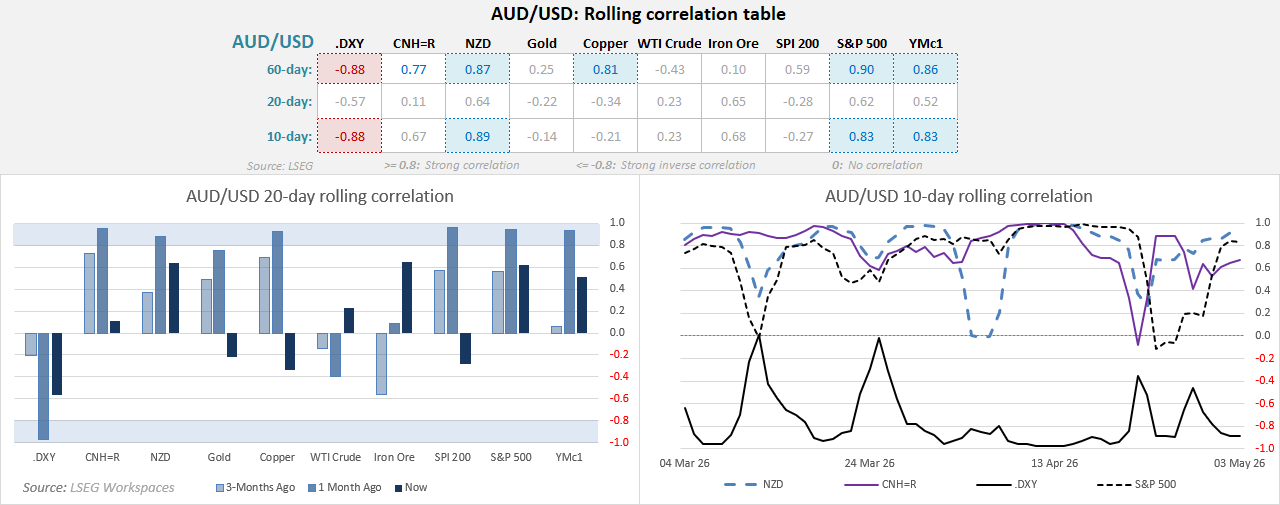
Direction hinges on the USD—softer dollar supports AUD/USD, rebound caps upside
- USD driving AUD/USD: Strong inverse correlation with DXY across the 10- and 60-day timeframes
- Risk sentiment supportive: Positive correlations with the S&P 500 and NZD remain firm
- China link secondary: CNH correlation is positive, but not the dominant driver
- Commodities mixed: Copper and gold correlations have softened in the short term
- Short-term noise: 10–20 day correlations are less stable, suggesting choppier trade
Source: LSEG
AUD/USD Futures Positioning | COT Report
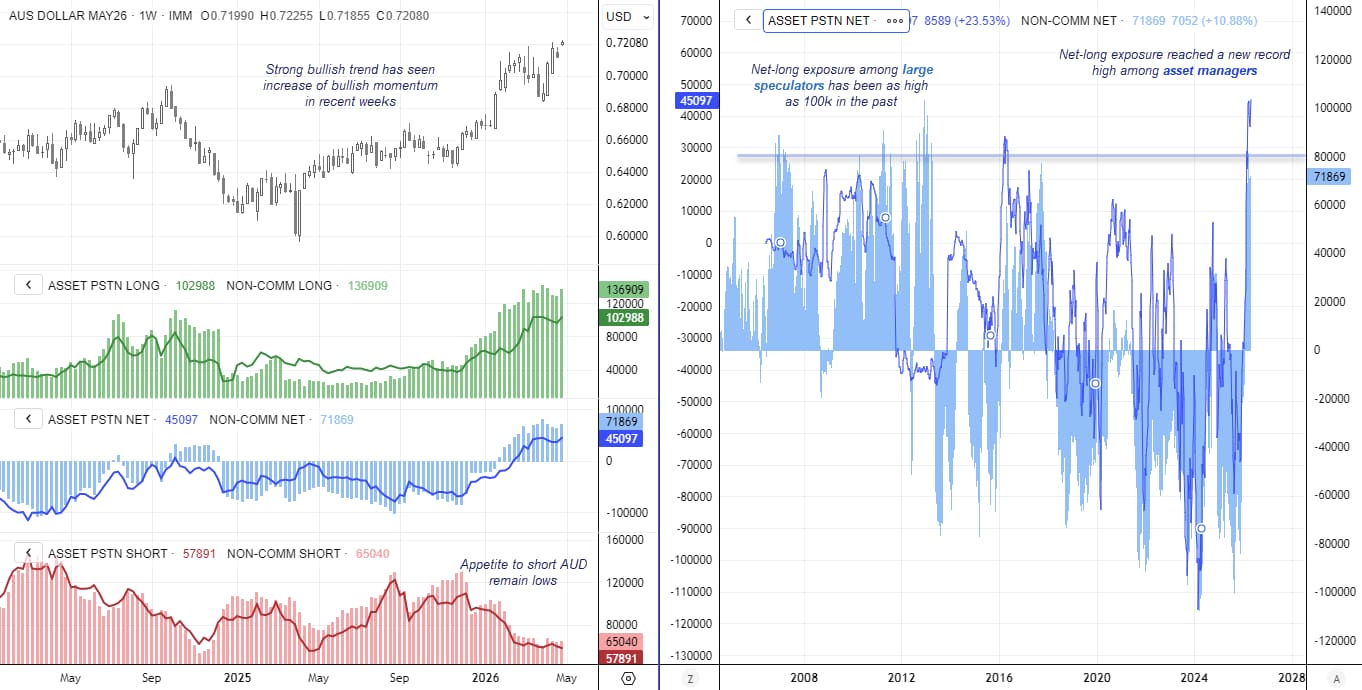
Traders increased their net-long exposure to Australian dollar futures last week by a combined 15.6k contracts. This brings asset managers’ net-long exposure to 45.1k contracts, back at a record high, while large speculators sit at 71.9k—less than 10k from a 13-year high.
While it could be argued that asset managers are at a sentiment extreme, large speculators have previously held bullish exposure above 80k for several weeks, and even reached as high as 100k.
If there is a risk to AUD/USD bulls, it may come from the RBA not delivering a hike that is deemed hawkish enough relative to expectations. That said, this is not my base case.
It seems likely the RBA will leave the door open for further tightening, which ultimately leaves the US dollar as the key driver of whether AUD/USD reaches 0.75 sooner rather than later—in line with my bias.
So while positioning remains stretched by some metrics—and price action on the daily is extended—I still think bulls can seek dips for the foreseeable future. However, caution is warranted, and chasing weak breakouts should be avoided.
Source: CFTC (COT) CME, LSEG
AUD/USD Holds Above 0.72, But Momentum Wavers Near Resistance
The breakout above 72c was not quite what I had in mind, given it only cleared the milestone level by 3 pips by Friday’s closed. Furthermore, a small shooting star candle on Friday shows a hesitancy to press ahead despite a solid bullish engulfing candle the day prior. Bulls may therefore want to err on the side of caution over the near term.
With that said, it is a solid uptrend and there is clearly demand around 0.7160, And with the monthly pivot point sitting just beneath the last week’s swing low, dips towards it could appeal to bulls seeking dips who – like me – anticipate a move to 73 and eventually 754c later this year.
A break below 0.7160 assumes a move towards 70c – a level that seems more likely to hold than not at this stage. Only a break below 70c shakes my confidence of a move up to 73c and beyond.

Source: ICE, TradingView
View the full economic calendar
-- Written by Matt Simpson
Follow Matt on Twitter @cLeverEdge
How to trade with City Index
You can trade with City Index by following these four easy steps:
- Open an account, or log in if you’re already a customer
• Open an account in the UK
• Open an account in Australia
• Open an account in Singapore
- Search for the market you want to trade in our award-winning platform
- Choose your position and size, and your stop and limit levels
- Place the trade