The Nikkei 225 is approaching record highs, supported by firm bullish positioning in futures markets. Yet while sentiment remains constructive, emerging cracks among key index constituents and hesitation on Wall Street suggest the path higher may not be straightforward. Traders may need to balance breakout potential with the risk of a near-term pullback.
View related analysis:
- Gold Loses Safe-Haven Appeal as Iran Skips Talks, Ceasefire Extended
- US Dollar Outlook: Peak War Uncertainty Weighs on USD, USD/CHF Eyes Breakdown
- ASX 200 Outlook: Consumer Stocks Lead, ASX Eyes 9000 Breakout
- ASX 200 Outlook: Tech Stocks Surge as Traders Eye Dips
Nikkei 225 Outlook: Bullish Positioning Supports Breakout Case
CME Nikkei 225 futures (NK) positioning – COT report:
Price action on the weekly chart shows an increasingly strong bullish trend, and one that appears on the cusp of breaking to a new record high. Notice that prices have paused around their record high, but the fact that we’ve seen three solid weeks of gains suggests a breakout over a trend reversal, even if the Nikkei decides to retrace a little first.
Market positioning is also constructive of an eventual breakout. Using the CME Nikkei futures positioning (Japanese yen denominated) from the weekly Commitment of traders (COT) report shows an increasingly bullish stance towards Japan’s stock market.
- Net-long exposure to Nikkei futures rose to a near 2-year high of 11.4k contracts last week
- Asset managers increased their net-long exposure to a 20-week high of 5.8k contracts
- Gross-long exposure has been trending higher among both sets of traders and gross-shorts remain historically low
Ultimately, there appears to be little appetite to short the Nikkei among futures traders. Moreover, gross-longs or net-long exposure do not appear to be near a sentiment extreme, further suggesting that any pullback may be limited.
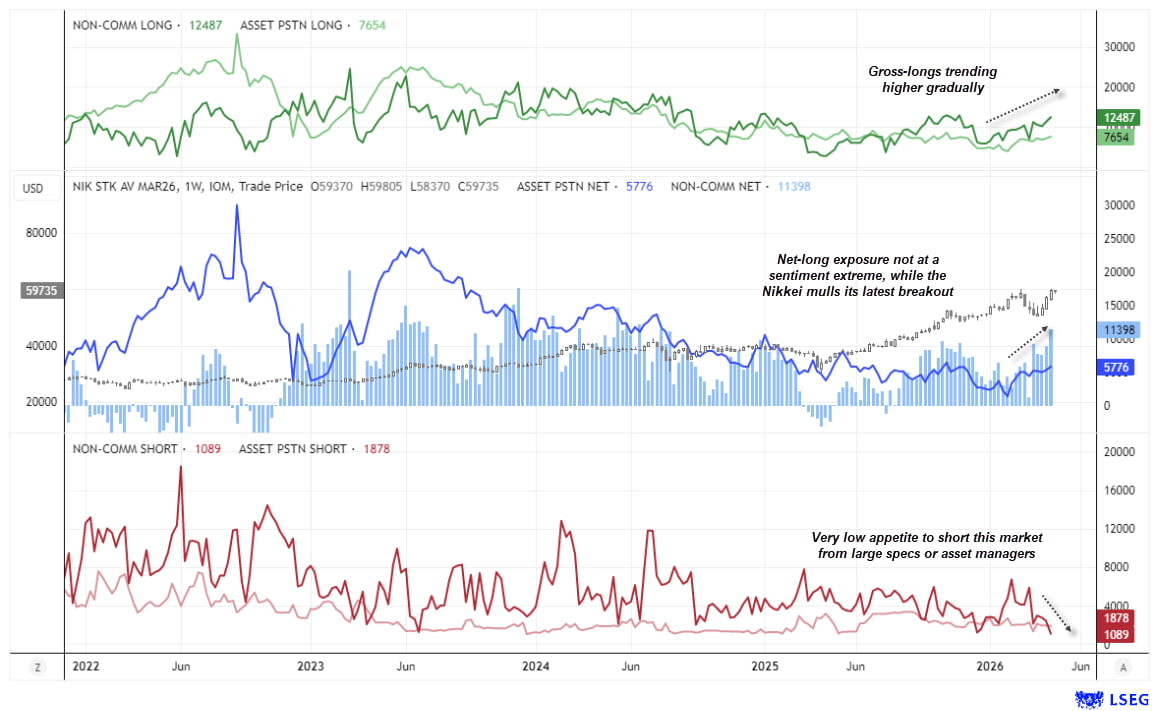
Chart analysis by Matt Simpson - Source: TradingView

Nikkei Heavyweights Flash Caution Signals Despite Bullish Index Setup
While a breakout in the Nikkei looks promising based on market positioning, its key constituents suggest potential headwinds in the near term.
- Fast Retailing (9983): The sharp rally has stalled around 75k, with momentum beginning to turn lower following a small shooting star candle last week.
- Tokyo Electron (8035): Similar to the Nikkei, price has returned near its highs. However, last week’s shooting star signals hesitation to break higher, and this week’s candle is pulling back from those levels.
- Advantest Corp (6857): Another heavyweight showing signs of hesitation, suggesting a near-term breakout may not be imminent.
- SoftBank Group (9984): The outlier, continuing to surge for a second week and breaking out of a bullish wedge formation — one for bulls to watch.
- Shin-Etsu Chemical (4063): A bullish breakout remains possible, but momentum has turned lower from the 2024 high, pointing to near-term caution among bulls.
- Sony Corp (6758): Price topped in November and has since moved into consolidation. A breakout in either direction is possible, although the downside currently appears favoured.
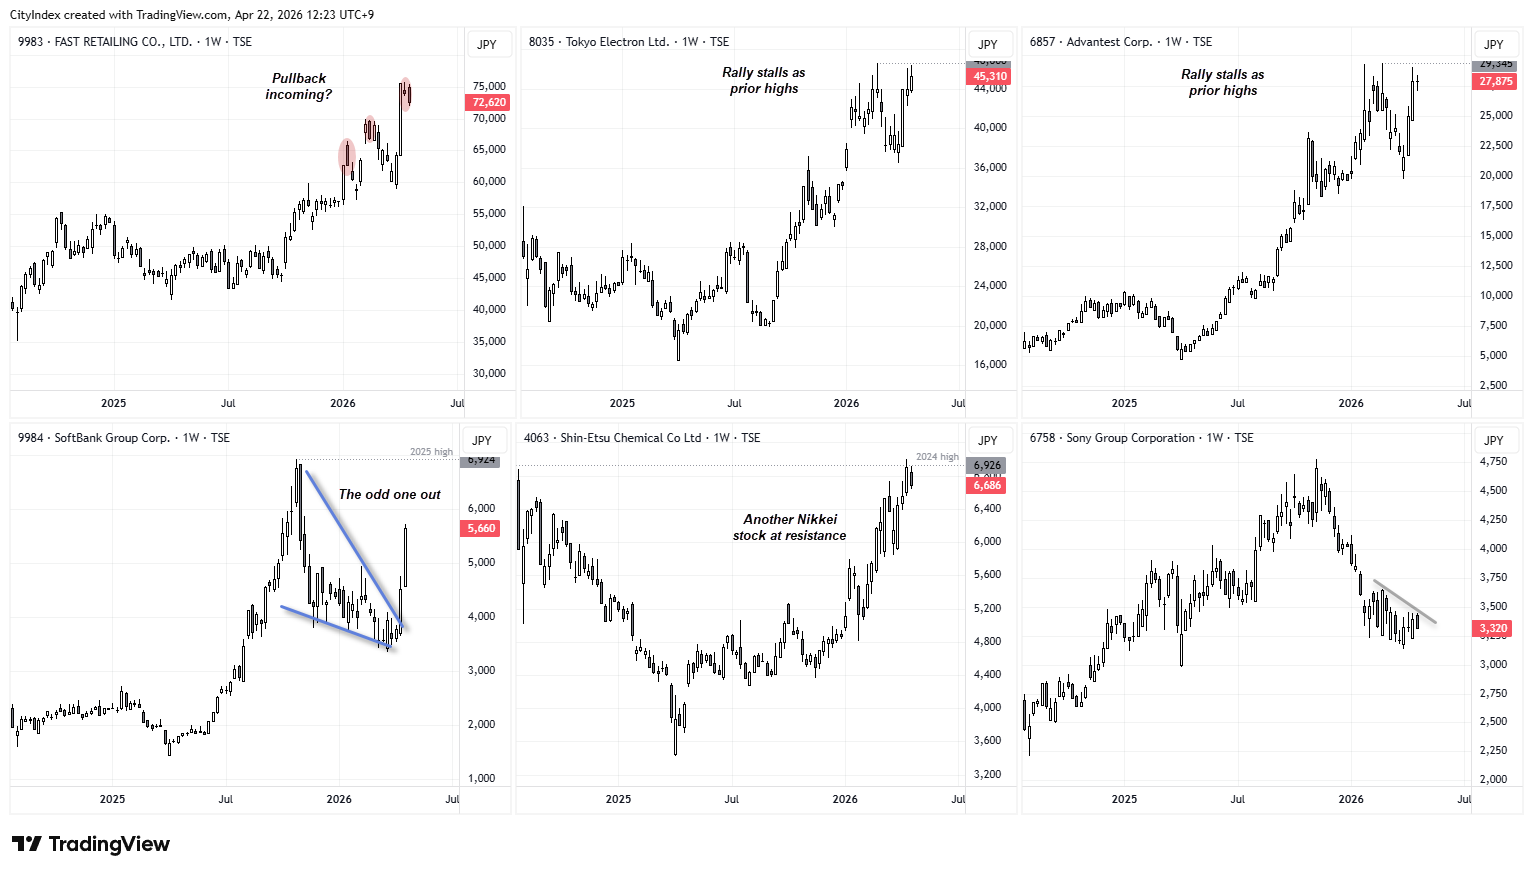
Source: TSE, TradingView
Nasdaq 100 Stalls at Record High as S&P 500 and Dow Jones Enter Consolidation
We should also factor in that Wall Street indices have posted a strong surge over the past three weeks. More importantly, Nasdaq 100 futures have stalled near their all-time high. This has seen the S&P 500 and Dow Jones enter a choppy consolidation on the daily timeframe, leaving traders wondering whether this is simply a pause for breath or the early stages of a pullback.
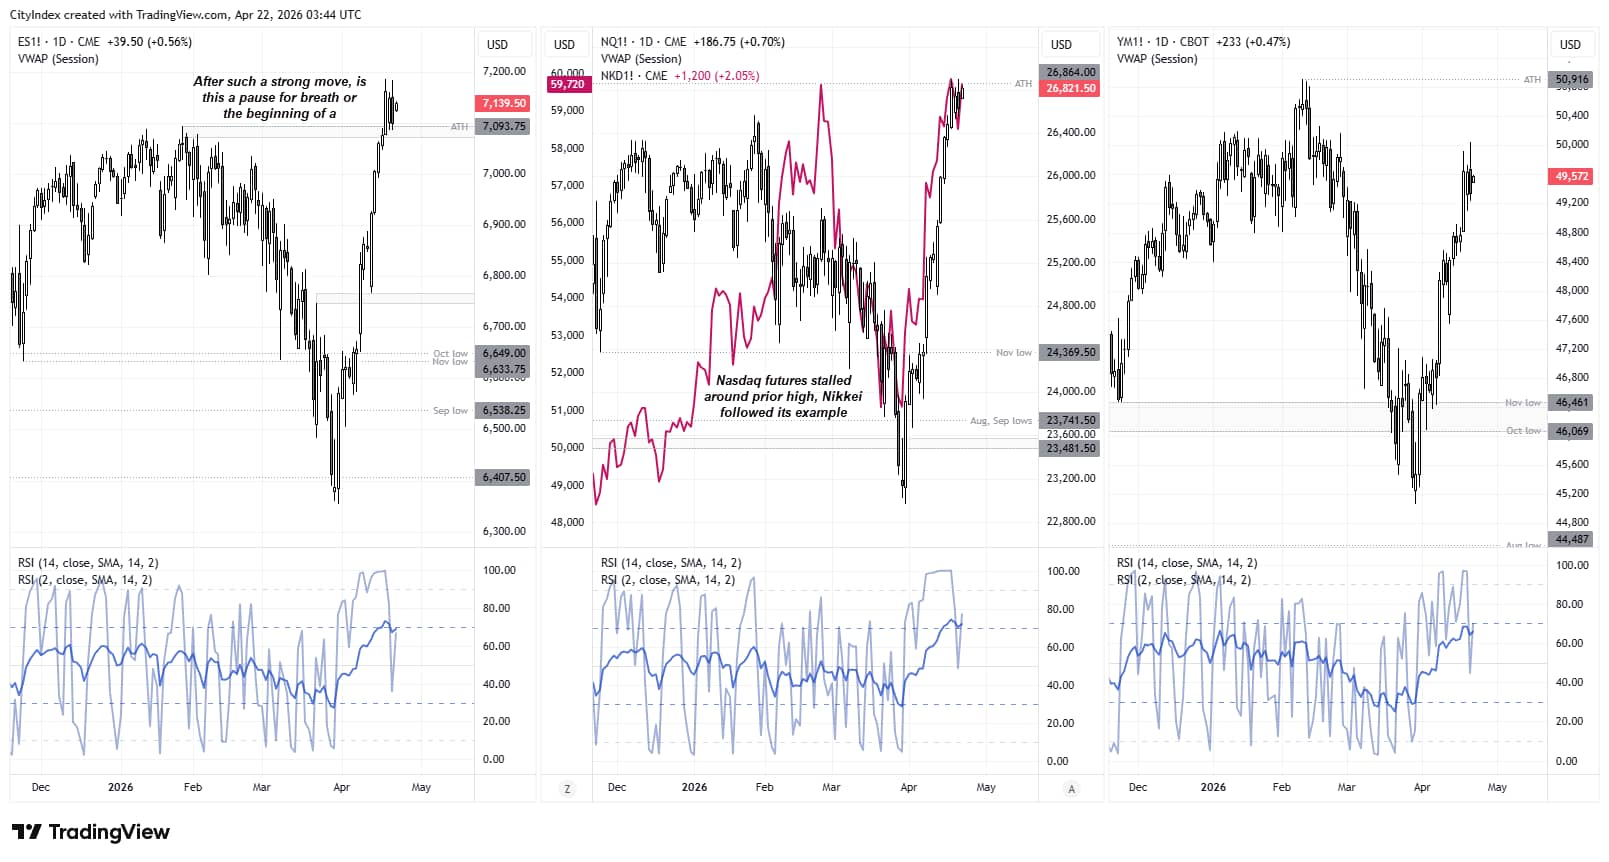
Source: TradingView

Nikkei 225 Tests 60k Resistance: Breakout or Pullback Ahead?
The daily chart (left) shows a solid uptrend into recent highs around 60k. Following a minor two-day pullback, momentum has turned higher once more as bulls consider a potential breakout. Traders should also monitor the aforementioned markets for signs of a pullback—particularly the Nasdaq 100. With tech earnings approaching, volatility is likely, and in some ways a pullback would be preferred as it could allow bulls to re-enter the trend at more favourable levels.
- The risk-reward for bulls below resistance is not particularly attractive at these levels, so they may prefer to wait for a confirmed breakout and see if resistance flips into support.
- If Nasdaq gains remain capped, Nikkei bulls could begin fading moves towards 60k in anticipation of a pullback towards the 57,500 area—near the 23.6% Fibonacci retracement and prior swing high.
- Alternatively, bulls could wait for a pullback towards 57,500 and look for evidence of a swing low before re-entering.
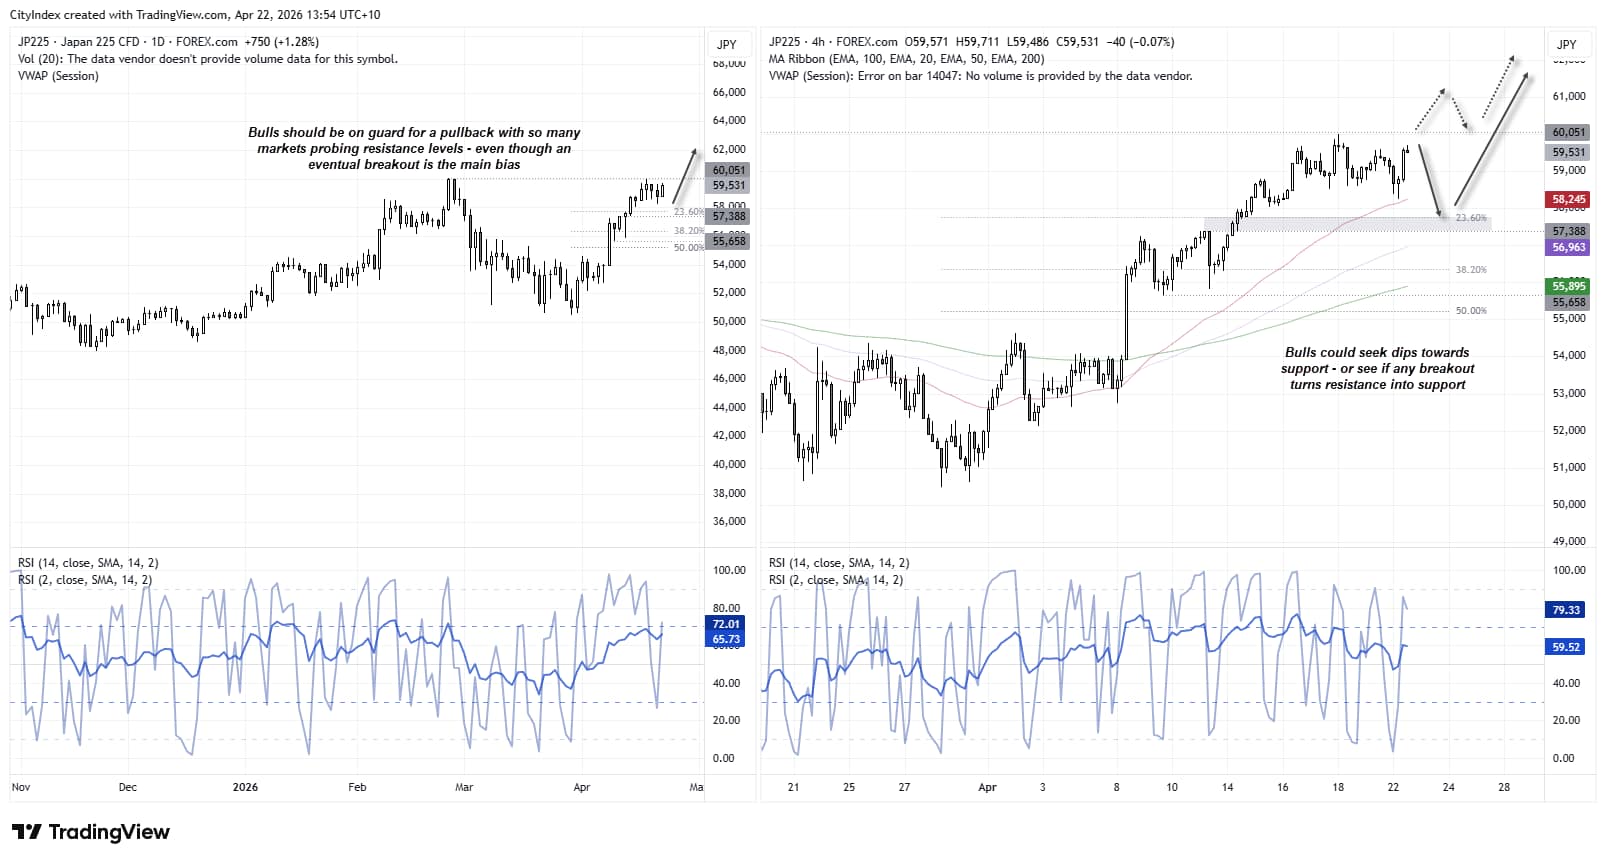
Source: Forex.com, TradingView
View the full economic calendar
-- Written by Matt Simpson
Follow Matt on Twitter @cLeverEdge
How to trade with City Index
You can trade with City Index by following these four easy steps:
- Open an account, or log in if you’re already a customer
• Open an account in the UK
• Open an account in Australia
• Open an account in Singapore
- Search for the market you want to trade in our award-winning platform
- Choose your position and size, and your stop and limit levels
- Place the trade