
Equity Indices Technical Forecast: Weekly Trade Levels
- U.S. equities were mixed this week with the Dow breaking to fresh record highs while the Nasdaq suffered the largest single-week decline since December.
- S&P 500 was off fractional with the monthly opening-range now defined just below key resistance.
- Nasdaq was down nearly 1.9% for the week with the February range set just above confluent support.
- Dow surged 2.5% with a breakout of the January range now approaching confluent uptrend resistance.
S&P 500 Price Chart – SPX500 Weekly
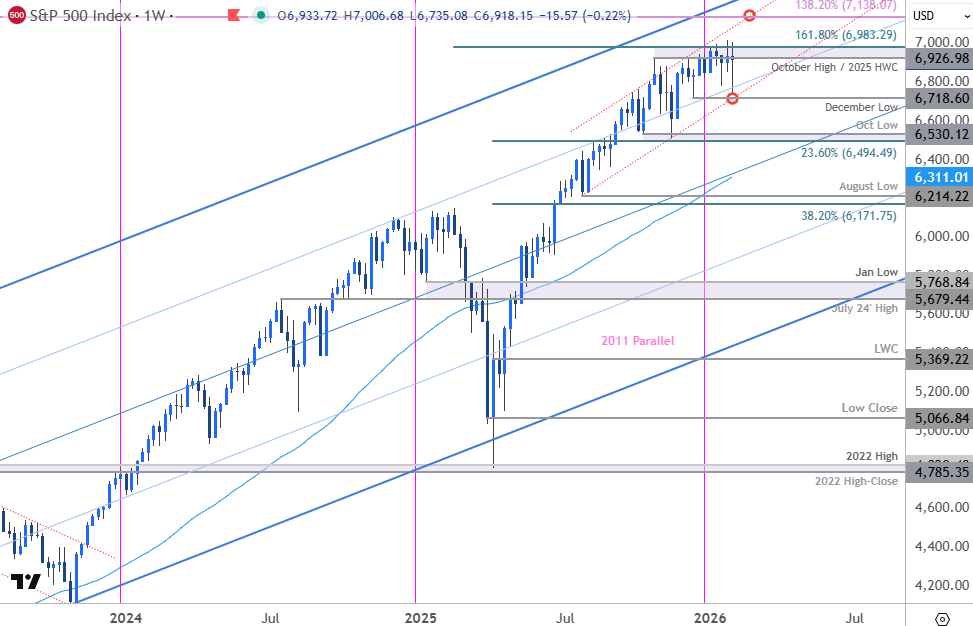
Chart Prepared by Michael Boutros, Sr. Technical Strategist; S&P 500 on TradingView
Technical Outlook: The S&P 500 has continued to hold just below confluent resistance since the start of the year at 6927/83- a region defined by the October high, the 2025 high-week close (HWC), and the 1.618% extension of the 2025 opening-range. The index has held below this key pivot zone for the past six-weeks with weekly RSI highlighting continued bearish divergence since October. The focus remains on possible inflection off this zone with a breach / weekly close above needed to fuel the next major leg of the advance.
S&P 500 Price Chart – SPX500 Daily
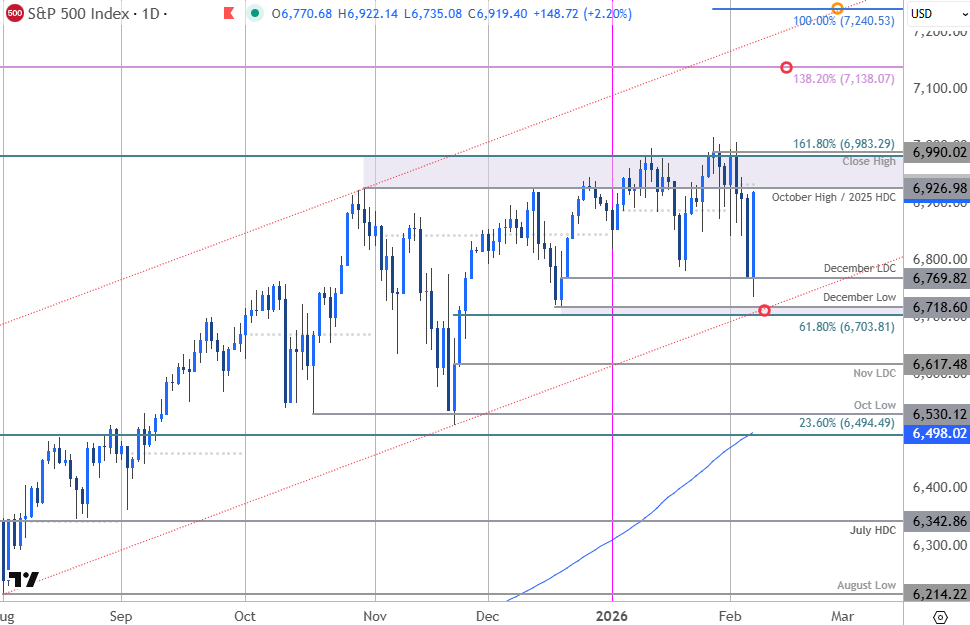
Chart Prepared by Michael Boutros, Sr. Technical Strategist; S&P 500 on TradingView
A closer look at the S&P 500 daily chart shows the index marking a four-day decline this week with a decline of more than 4% off the January high registering a close low at the December low-day close (LDC). The bulls mounted an impressive rebound on Friday with a massive outside-day reversal recovering nearly 2.7% off the lows. The monthly range is set just below key resistance, and the focus is on a breakout to offer medium-term guidance.
Initial support rests at 6970 backed by bullish invalidation at the 61.8% retracement of the November rally and the December low at 6704/19. Note that the August trendline converges on this threshold over the next few days and a break / close below would be needed to suggest a more significant high is in place and a larger reversal is underway. Subsequent support seen at the November LDC at 6617 and the October swing low at 6530.
Monthly open resistance is eyed at 6934 with a breach / close above the record close high at 6990 ultimately needed to fuel the next leg of the advance. Subsequent resistance objectives are eyed at the 1.382% extension of the broader 2020 advance near 7138 and the 100% extension of the November rally at 7240.
Bottom line: An outside-day reversal off the lows takes the S&P 500 back into a key resistance zone that has capped the equity rally since October. From a trading standpoint, losses would need to be limited to 6704 IF the index is heading higher on this stretch with a close above 6990 needed to mark uptrend resumption.
Nasdaq Price Chart – NDX Weekly
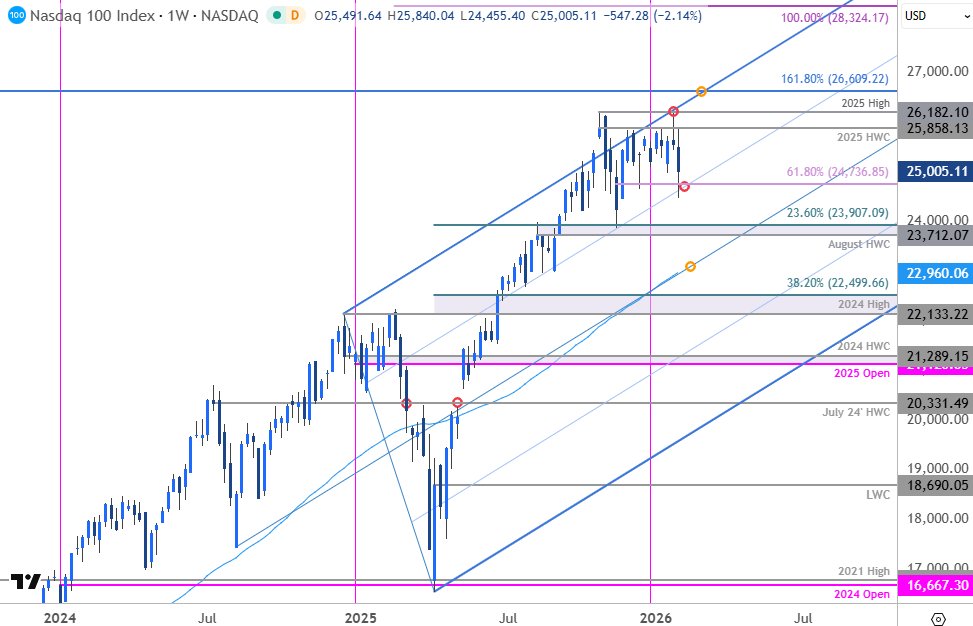
Chart Prepared by Michael Boutros, Sr. Technical Strategist; NDX on TradingView
Technical Outlook: The Nasdaq marked a second-consecutive weekly decline with the index falling more than 6.5% off the yearly high. A rebound on Friday averted a weekly close below the 61.8% retracement of the November rally at 24,737. While a break below the January range does threaten further downside, the focus is on potential inflection off this zone in the days ahead. Note that the 75% parallel converges on this level over the next few weeks.
A break / close below this slope would suggest a more significant high is in place and a larger correction is underway. Subsequent support is seen at the August high-week close (HWC) and the 23.6% retracement of the 2025 range at 23,712/908 and the 52-week moving average, currently near ~22960. Both levels of interest for possible downside exhaustion / price inflection IF reached.
Initial resistance is eyed at the 2025 high-week close (HWC) at 25,858 backed closely by the 2025 swing high at 26,182. A breach / close above this threshold is needed to mark uptrend resumption toward the 1.618% extension of the broader 2020 advance at 26,609. Note that the upper parallel converges on this threshold into the close of the month- look for a larger reaction there IF reached.
Bottom line: The tech-heavy Nasdaq is the most vulnerable of the major indices. The index is trading just above uptrend support, and the immediate focus is on a breakout of this week’s range for guidance. From a trading standpoint, rallies would need to be limited to the monthly open at 25,491 IF price is heading for a deeper correction here with a weekly close below 24,736 needed to fuel the next leg of the decline.
Dow Jones Price Chart – DJI Weekly
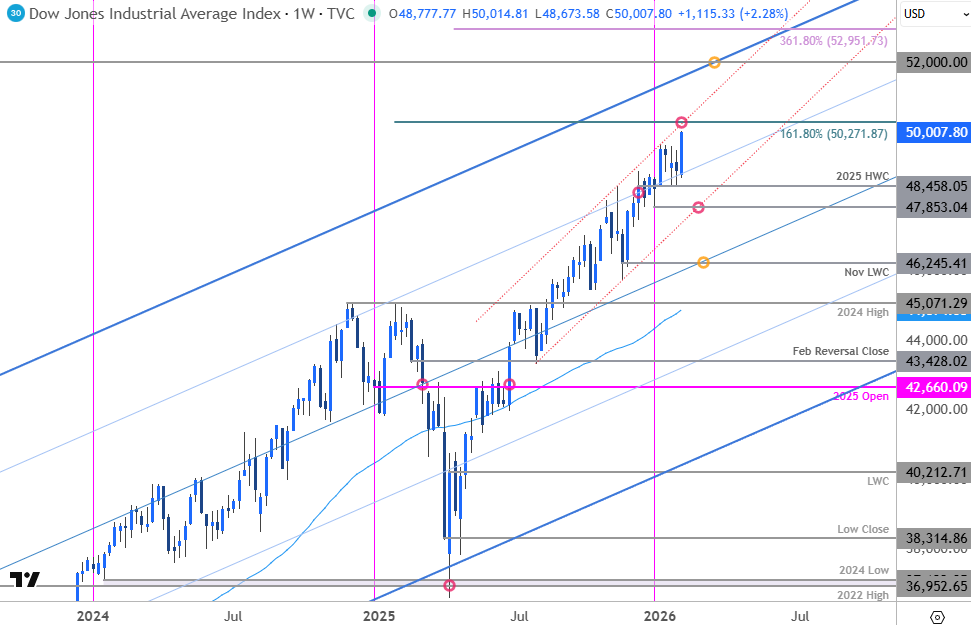
Chart Prepared by Michael Boutros, Sr. Technical Strategist; DJI on TradingView
Technical Outlook: In last month’s Dow Forecast we noted that, “The monthly range is set just above support- look for the breakout to offer guidance here. From a trading standpoint, losses should be limited to 48,279 IF the index is heading higher on this stretch with a break above the monthly range high needed to fuel the next leg of the advance towards channel resistance / 50,272.” The monthly range held into the close of January with DJI registering a low at 48,460 last week before rebounding. The index surged 3.6% off the low this week to mark a fresh record high close on Friday.
The Dow is now within striking distance of confluent resistance at the 1.618% extension of the 2025 range breakout at 50,272. Note that channel resistance (red) converges on this threshold next week and the focus is on possible inflection off this zone in the days ahead. A topside breach / close above would be needed to fuel the next leg of the uptrend with subsequent resistance objectives eyed at the upper parallel near 52,000 and the 3.618 extension of the April rally at 52,952.
Weekly support now rests with the 2025 high-week close (HWC) at 48,458 and is backed by the January low at 47,853. Channel support converges on this level into the close of the month and losses below this slope would invalidate the July channel and threaten a larger correction toward bullish invalidation at the November low-week close (LWC) at 46,245.
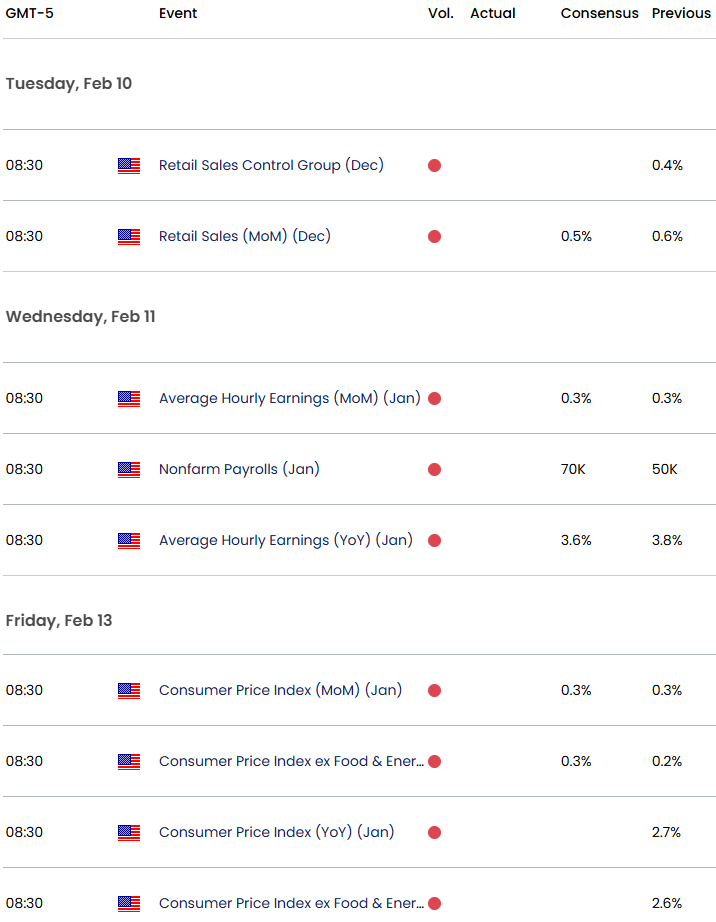
Bottom line: A breakout of a multi-week range in the Dow has stretched to fresh record highs with the advance now approaching uptrend resistance. Look for a reaction there in the coming days. From a trading standpoint, losses should be limited to the monthly open at 48,778 IF price is going to extend higher on this stretch with a close above 50,272 needed to fuel the next major leg of the advance. Keep in mind we get the release of the January Non-Farm Payrolls report next week with key inflation data (CPI) on tap Friday.
Key US Economic Data Releases
--- Written by Michael Boutros, Senior Technical Strategist
Follow Michael on X @MBForex